View methods side by side.
Choose up to four methods. Add them using the search and share the comparison by copying its link.
| Criterion | 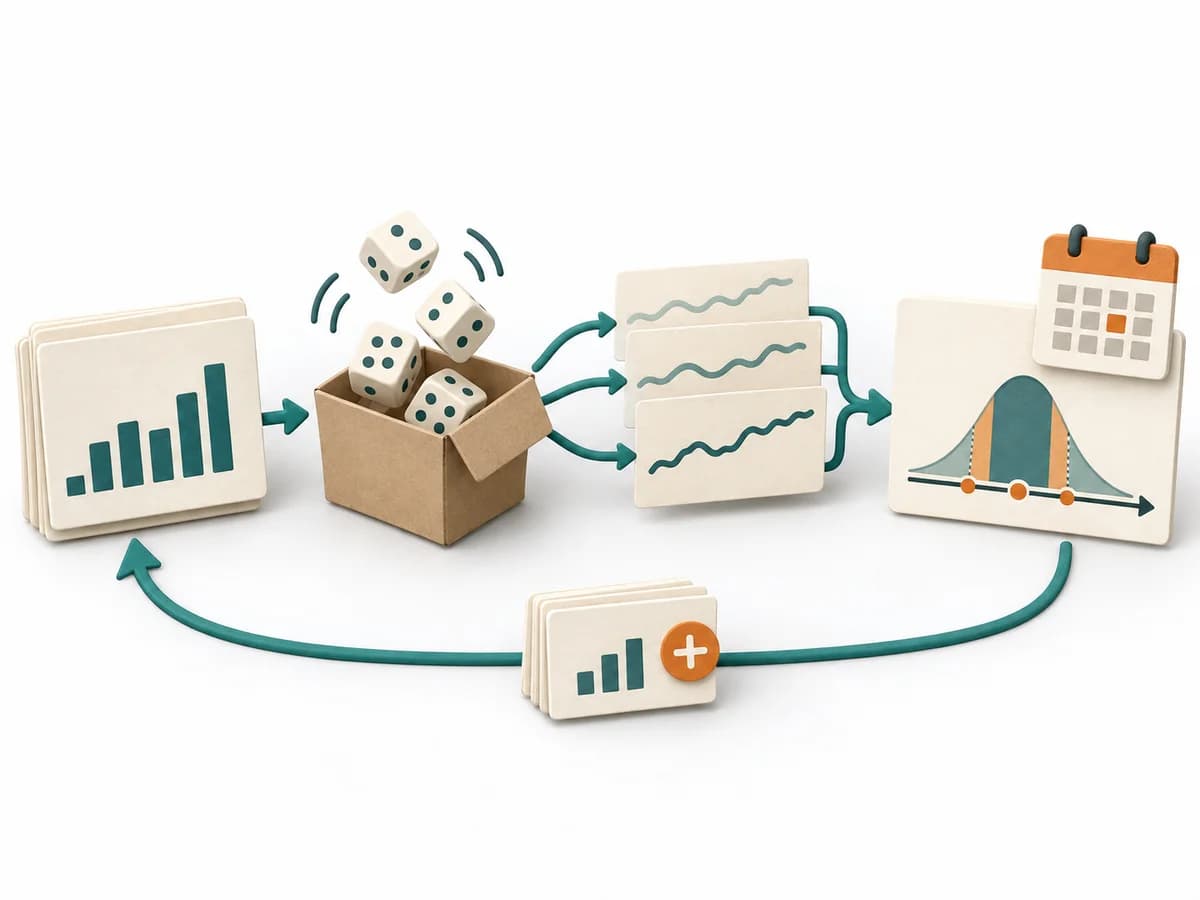 Delivery Monte Carlo Forecasting |  Engineering Kanban |  Systems Thinking Causal Loop Diagram |  Systems Thinking Current Reality Tree |
|---|---|---|---|---|
Purposedifferent | Helps clarify scope, sequence, and delivery flow in concrete terms. It makes work, boundaries, and order steerable. The result is captured as Forecast Percentiles, Throughput Dataset, and Risk Communication. | When work sits in too many parallel streams, throughput suffers and no one sees the bottlenecks. Kanban makes the flow of work visible and limits overload so a system becomes calmer and more predictable. | A Causal Loop Diagram makes feedback, reinforcement, and balance in a system legible. It uncovers side effects and self-reinforcement that stay hidden in linear explanations. | A Current Reality Tree condenses many symptoms into a few causal chains. The method makes visible which core problems drive several negative effects at once. |
Complexitydifferent | High | Medium | Medium | High |
Timedifferent | 30-90 min Setup, danach laufend | Ongoing | 1-3 h | 2-6 h |
Participantsdifferent | 1-8 | 2-12 | 2-8 | 3-8 |
Formatdifferent | Workshop + async | Workshop + async | Workshop | Workshop |
Outputdifferent | Forecast Percentiles, Throughput Dataset, Risk Communication | Kanban board, WIP policies, Flow metrics | Causal Loop Diagram, Feedback Notes, Leverage Points | Current Reality Tree, Core Problems, Intervention Ideas |
Tagsno overlap | ForecastingFlowDelivery | FlowVisual managementDelivery | FeedbackSystems thinkingCausalityDynamics | Systems thinkingRoot causeConstraintsCausality |