View methods side by side.
Choose up to four methods. Add them using the search and share the comparison by copying its link.
| Criterion |  Product Strategy KPI Tree |  Product Strategy Counter Metrics | 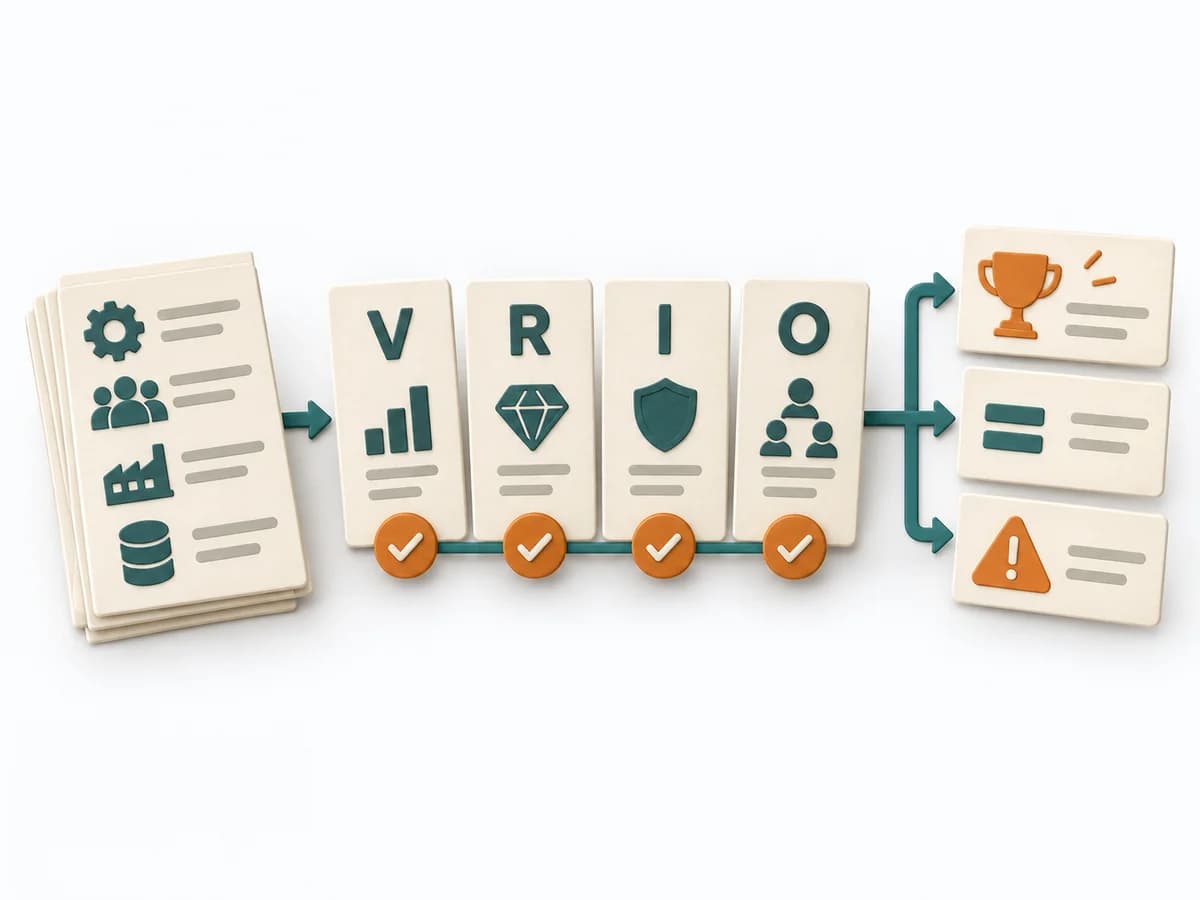 Business Strategy VRIO Framework |  Business Strategy Value Chain Analysis |
|---|---|---|---|---|
Purposedifferent | When metrics across the organization drift apart, it arranges drivers and effects under one shared logic. It connects customer value, product logic, and decision priorities. The result is captured as a KPI tree and owner list. | When a headline metric could mask side effects, it adds guardrail signals against unwanted outcomes. It connects customer value, product logic, and decision priorities. The result is captured as a counter-metric list and guardrail definitions. | The VRIO Framework rates resources and capabilities on whether they are Valuable, Rare, Inimitable, and Organized. It compares strengths, risks, market logic, and courses of action. The result is captured as a VRIO table and strategic actions. | Value Chain Analysis shows where value is created, costs accrue, and differentiation becomes possible along the process. It compares strengths, risks, market logic, and courses of action. The result is captured as a value-chain map and lever list. |
Complexitydifferent | Medium | Low | Medium | High |
Timedifferent | 90-180 min initial, dann laufend | 30-60 min | 90-180 min | Half day |
Participantsdifferent | 3-8 | 2-6 | 3-6 | 3-8 |
Formatdifferent | Workshop + async | Workshop + async | Workshop | Workshop |
Outputdifferent | KPI Tree, Owner List | Counter Metric List, Guardrail Definitions | VRIO Table, Strategic Actions | Value Chain Map, Lever List |
Tags1 shared | MetricsStrategyAlignmentMeasurement | MetricsMeasurementStrategyExperiments | StrategyDiagnosisBusiness modelCapability | StrategyBusiness modelDiagnosisAnalysis |