View methods side by side.
Choose up to four methods. Add them using the search and share the comparison by copying its link.
| Criterion |  Growth Golden Circle | 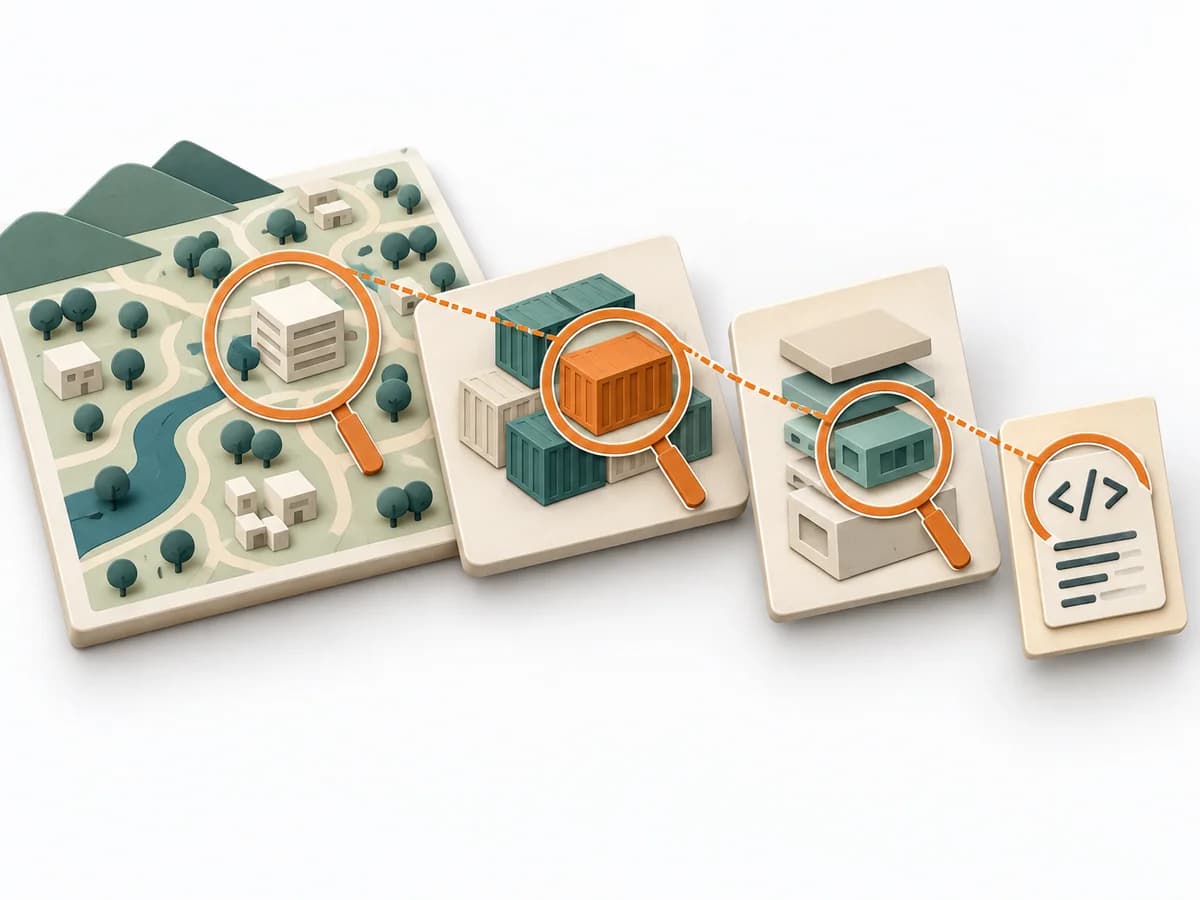 Architecture C4 Model |  Operations Fishbone Diagram |  Operations Scatter Diagram |
|---|---|---|---|---|
Purposedifferent | In positioning and communication, what an offering actually stands for often becomes blurred. The Golden Circle sharpens a product's inner rationale and connects purpose, approach, and offering into a clear statement. | The C4 Model makes a system legible across several resolution levels, from context down to code. It suits situations where different audiences need to understand the same architecture from different altitudes. | When a problem has several possible contributing factors, the method sorts causes by cause areas. It prevents an initial hunch from blocking the view of other plausible drivers. | When the question is whether two measures are related, the method makes patterns in the data picture visible. It separates felt correlations from relationships that actually show up in the data. |
Complexitysame | Low | Low | Low | Low |
Timedifferent | 30-60 min | 1-4 h | 30-60 min | 30-90 min |
Participantsdifferent | 1-8 | 1-5 | 2-8 | 1-4 |
Formatdifferent | Workshop + async | Workshop + async | Workshop | Workshop + async |
Outputdifferent | Why Statement, Messaging Notes, Positioning Draft | Context Diagram, Container Diagram, Component Diagram | Fishbone Diagram, Cause Categories, Investigation Backlog | Scatter Plot, Korrelationsnotiz, Hypothesenliste |
Tagsno overlap | MarketingPositioningCommunication | ArchitectureCommunicationVisualization | Root causeQualityOperations | Root causeQualityVisualization |