View methods side by side.
Choose up to four methods. Add them using the search and share the comparison by copying its link.
| Criterion |  Business Strategy GAP Analysis | 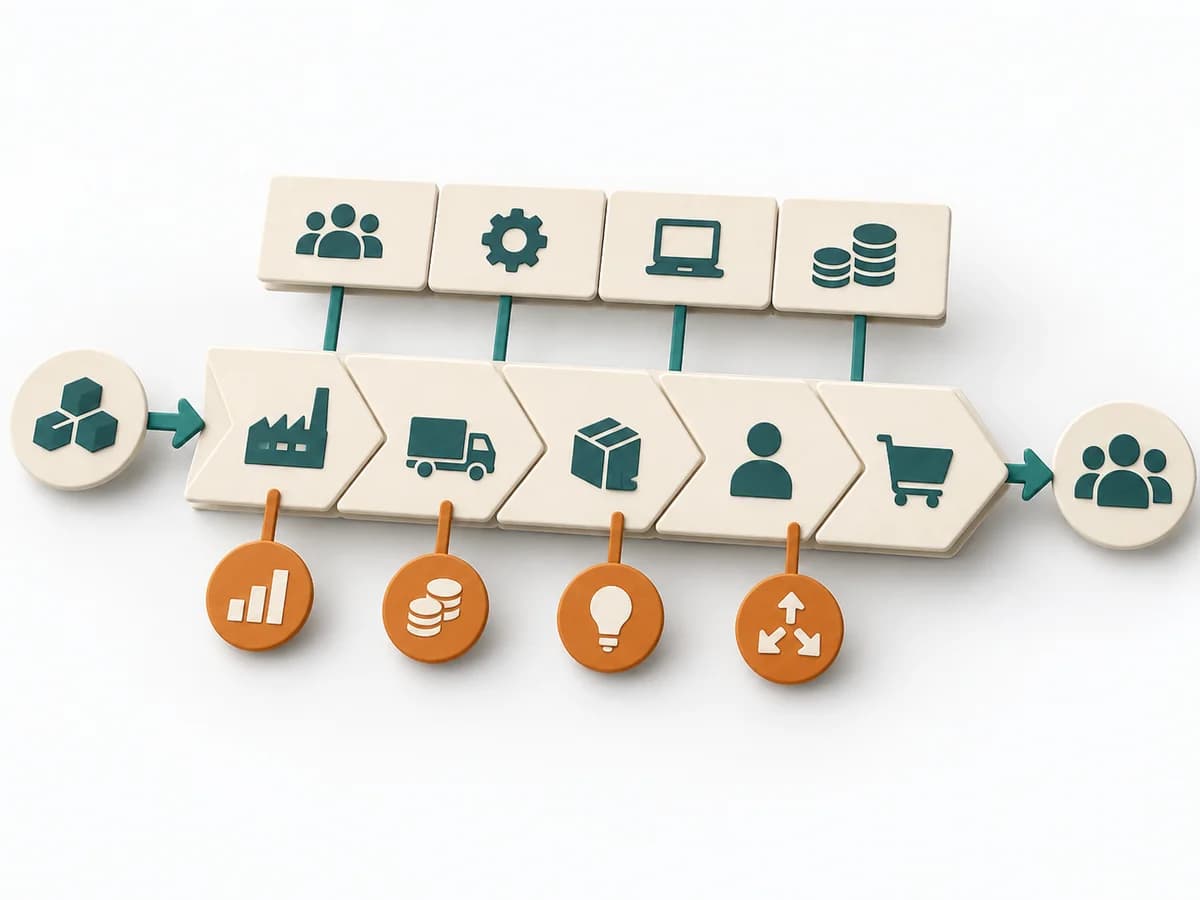 Business Strategy Value Chain Analysis |  Operations Fishbone Diagram |  Operations 8D Problem Solving |
|---|---|---|---|---|
Purposedifferent | GAP Analysis compares the current state with a target picture and makes the distance manageable. It becomes useful when, ahead of new initiatives, it must become clear which capabilities, processes, or resources are missing. | Value Chain Analysis shows where value is created, costs accrue, and differentiation becomes possible along the process. It compares strengths, risks, market logic, and courses of action. The result is captured as a value-chain map and lever list. | When a problem has several possible contributing factors, the method sorts causes by cause areas. It prevents an initial hunch from blocking the view of other plausible drivers. | For an acute quality or delivery problem, the method structures immediate protection and root cause work together. It keeps the situation stable while the actual cause is investigated cleanly. |
Complexitydifferent | Medium | High | Low | High |
Timedifferent | 1-3 h | Half day | 30-60 min | 1-6 Wochen |
Participantsdifferent | 2-8 | 3-8 | 2-8 | 4-10 |
Formatdifferent | Workshop + async | Workshop | Workshop | Workshop + async |
Outputdifferent | Gap Matrix, Action Plan, Risk Notes | Value Chain Map, Lever List | Fishbone Diagram, Cause Categories, Investigation Backlog | 8D Report, Containment Plan, Root Cause Evidence, Corrective Action Plan |
Tagsno overlap | StrategyAnalysisPlanning | StrategyBusiness modelDiagnosisAnalysis | Root causeQualityOperations | QualityProblem solvingRoot cause |