View methods side by side.
Choose up to four methods. Add them using the search and share the comparison by copying its link.
Selected:Failure Scenario Analysis3-Circle Venn DiagramChange AnalysisFailure Mode and Effects Analysis
| Criterion | 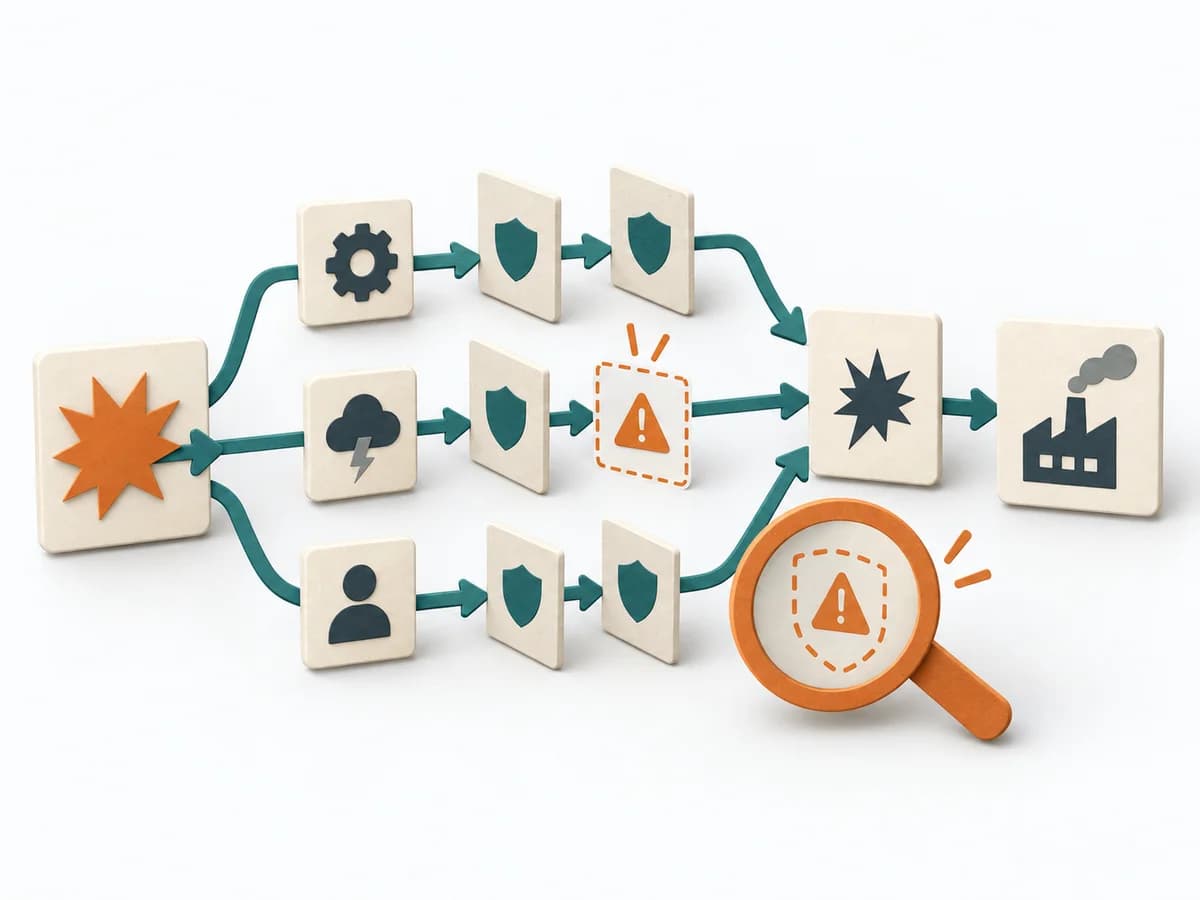 Engineering Failure Scenario Analysis |  Facilitation 3-Circle Venn Diagram |  Operations Change Analysis |  Operations Failure Mode and Effects Analysis |
|---|---|---|---|---|
Purposedifferent | In critical processes, it is not enough to plan only for the normal case. Failure Scenario Analysis looks at the path into failure and shows which failures, chains, and control gaps cause the most damage. | When three perspectives matter at the same time, a Three-Circle Venn Diagram shows the overlaps and remainders precisely. It makes visible where shared effect arises and where only a partial perspective applies. | For a deviation after a change, the method isolates the influence of the altered condition. It narrows down which differences are relevant and which are just accompanying noise. | For a process, product, or service with noticeable failure risks, the method assesses possible failure modes in advance. It directs attention to combinations of occurrence, effect, and detectability. |
Complexitydifferent | Medium | Low | Medium | High |
Timedifferent | 1-3 h | 15-45 min | 45-120 min | 2-6 h |
Participantsdifferent | 3-8 | 2-8 | 2-6 | 3-10 |
Formatdifferent | Workshop | Workshop + async | Workshop + async | Workshop |
Outputdifferent | Failure Scenarios, Risk Notes, Control Gaps, Test and Response Actions | Venn Diagram, Overlap Notes, Differentiators | Change Matrix, Cause Hypotheses, Validation Questions, Action List | FMEA Table, Risk Priority, Mitigation Actions |
Tagsno overlap | FailureResilienceRisk | ComparisonFacilitationAlignment | ChangeRoot causeTroubleshootingComparison | RiskQualityOperationsRoot cause |