View methods side by side.
Choose up to four methods. Add them using the search and share the comparison by copying its link.
| Criterion | 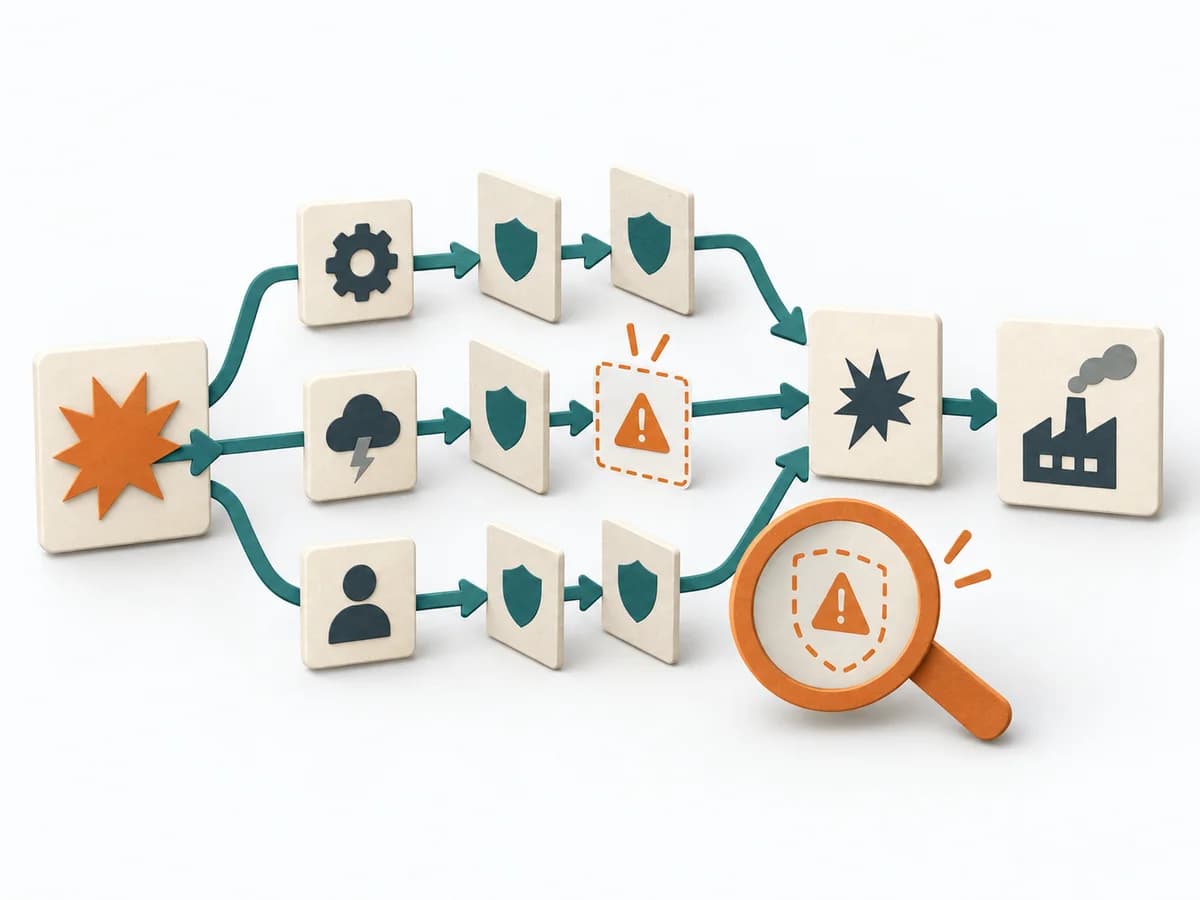 Engineering Failure Scenario Analysis | 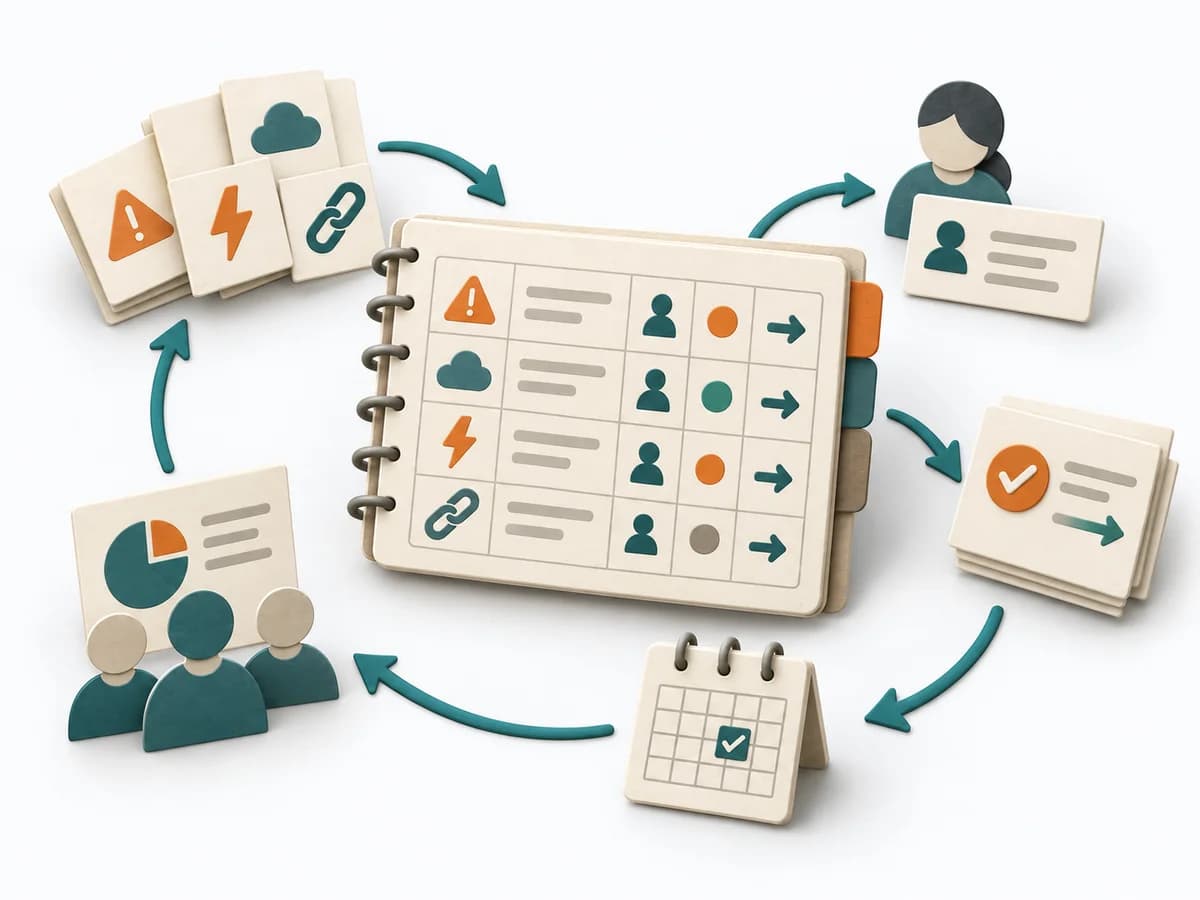 Delivery RAID Log |  Operations Fishbone Diagram |  Operations Failure Mode and Effects Analysis |
|---|---|---|---|---|
Purposedifferent | In critical processes, it is not enough to plan only for the normal case. Failure Scenario Analysis looks at the path into failure and shows which failures, chains, and control gaps cause the most damage. | Helps clarify scope, sequence, and delivery flow in concrete terms. It makes work, boundaries, and order steerable. The result is captured as a RAID Log and a source for status reporting. | When a problem has several possible contributing factors, the method sorts causes by cause areas. It prevents an initial hunch from blocking the view of other plausible drivers. | For a process, product, or service with noticeable failure risks, the method assesses possible failure modes in advance. It directs attention to combinations of occurrence, effect, and detectability. |
Complexitydifferent | Medium | Low | Low | High |
Timedifferent | 1-3 h | 30 min Setup, dann laufend | 30-60 min | 2-6 h |
Participantsdifferent | 3-8 | 1-3 maintaining, briefing for everyone | 2-8 | 3-10 |
Formatdifferent | Workshop | Async | Workshop | Workshop |
Outputdifferent | Failure Scenarios, Risk Notes, Control Gaps, Test and Response Actions | RAID Log, Status Report Source | Fishbone Diagram, Cause Categories, Investigation Backlog | FMEA Table, Risk Priority, Mitigation Actions |
Tagsno overlap | FailureResilienceRisk | RiskTrackingStakeholdersGovernance | Root causeQualityOperations | RiskQualityOperationsRoot cause |