View methods side by side.
Choose up to four methods. Add them using the search and share the comparison by copying its link.
| Criterion | 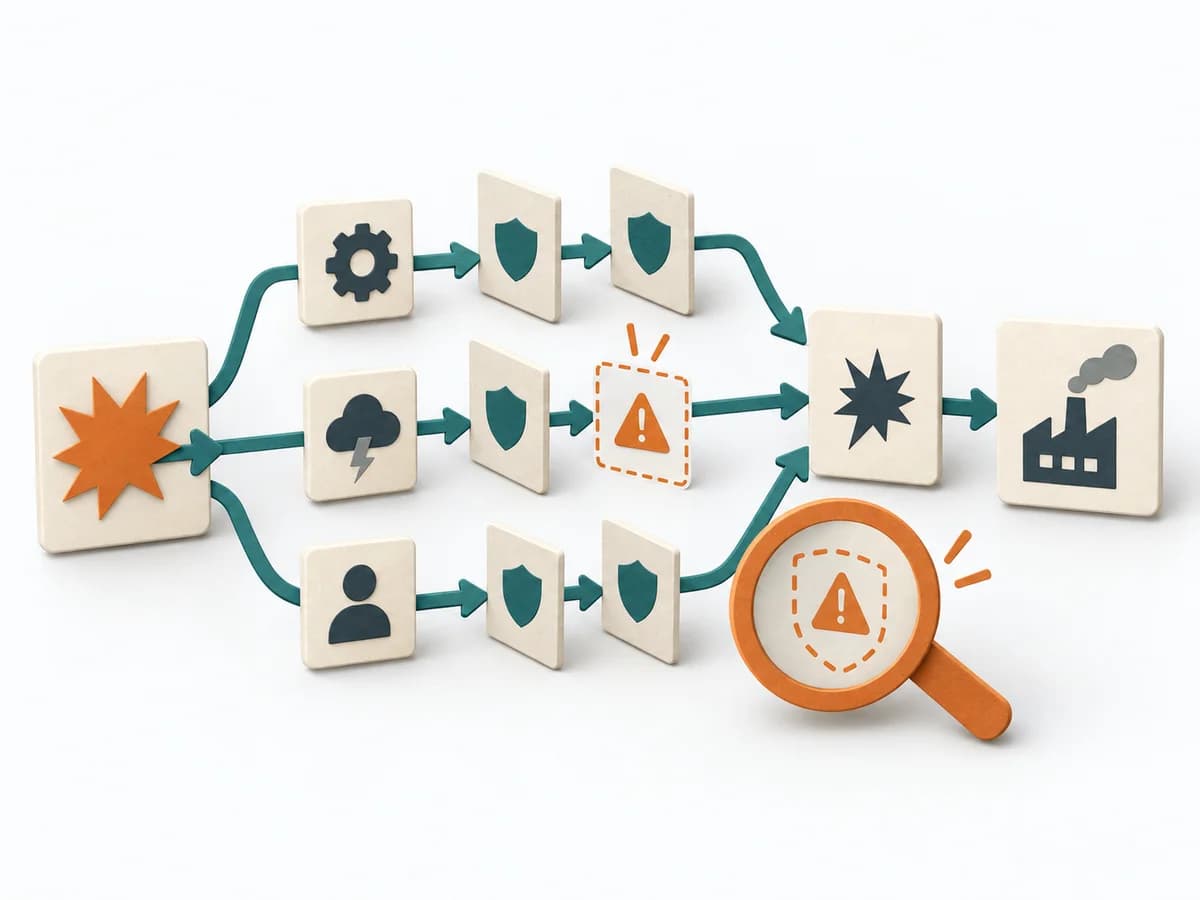 Engineering Failure Scenario Analysis | 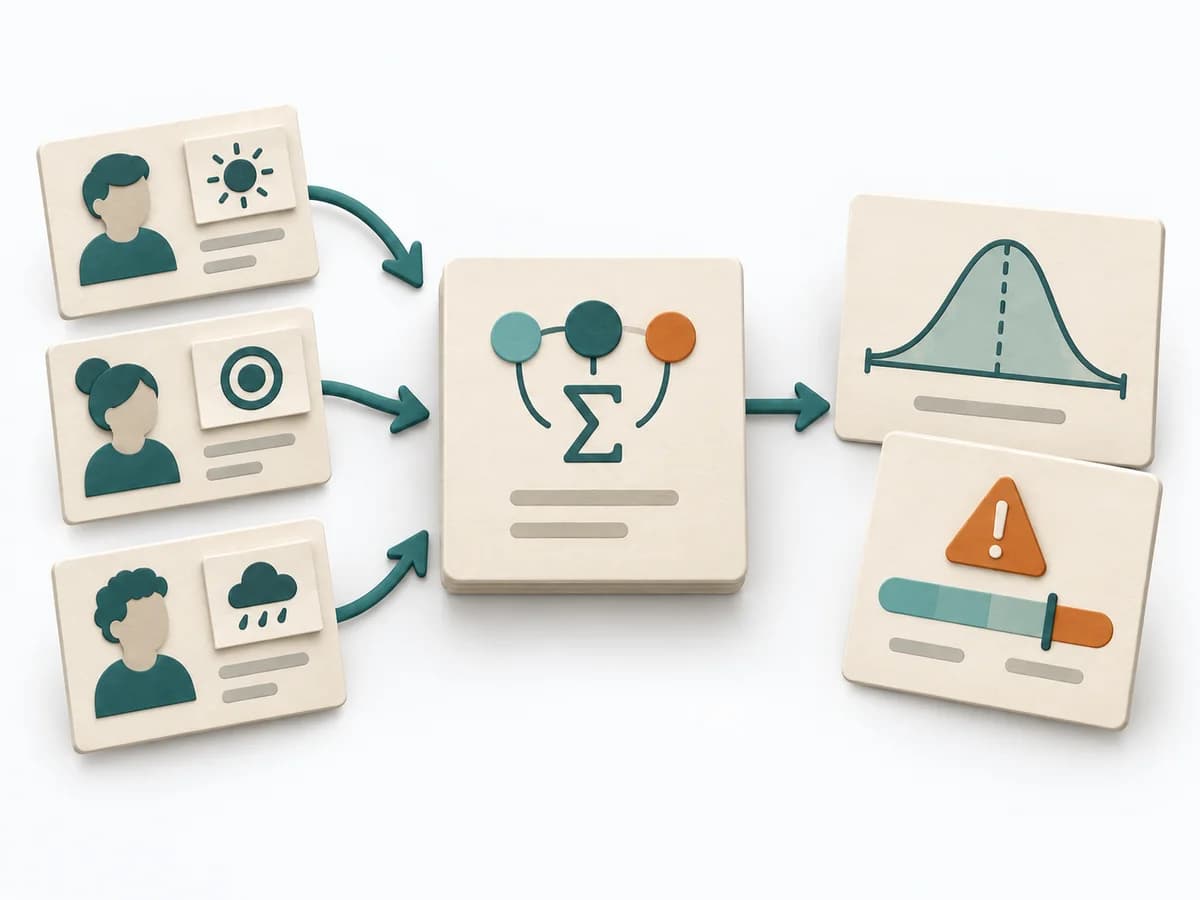 Decision Making PERT Estimation |  Decision Making Decision Tree |  Facilitation Dot Estimation |
|---|---|---|---|---|
Purposedifferent | In critical processes, it is not enough to plan only for the normal case. Failure Scenario Analysis looks at the path into failure and shows which failures, chains, and control gaps cause the most damage. | On complex initiatives, a plain average tends to understate just how uncertain the outcome really is. It separates options, evaluation criteria, and open risks. The result is captured as a PERT Estimate, Expected Value, and Risk Notes. | For decisions with follow-on paths and dependencies, a linear comparison is often not enough. A Decision Tree shows how options branch under conditions and which consequences hang on each branch. | When size or effort can only be estimated roughly, Dot Estimation condenses the group's experience into a quick range. It turns individual contributions into a visible selection. The result is captured as an Effort Heatmap, Risk Signals, and Discussion Targets. |
Complexitydifferent | Medium | Medium | Medium | Low |
Timedifferent | 1-3 h | 15-45 min | 30-90 min | 5-20 min |
Participantsdifferent | 3-8 | 1-8 | 1-6 | 3-20 |
Formatdifferent | Workshop | Workshop + async | Workshop + async | Workshop |
Outputdifferent | Failure Scenarios, Risk Notes, Control Gaps, Test and Response Actions | PERT Estimate, Expected Value, Risk Notes | Decision Tree, Option Map, Assumption List | Effort Heatmap, Risk Signals, Discussion Targets |
Tagsno overlap | FailureResilienceRisk | EstimationUncertaintyRisk | DecisionTreeOptions | EstimationEffortRisk |