View methods side by side.
Choose up to four methods. Add them using the search and share the comparison by copying its link.
| Criterion |  UX Research Empathy Mapping | 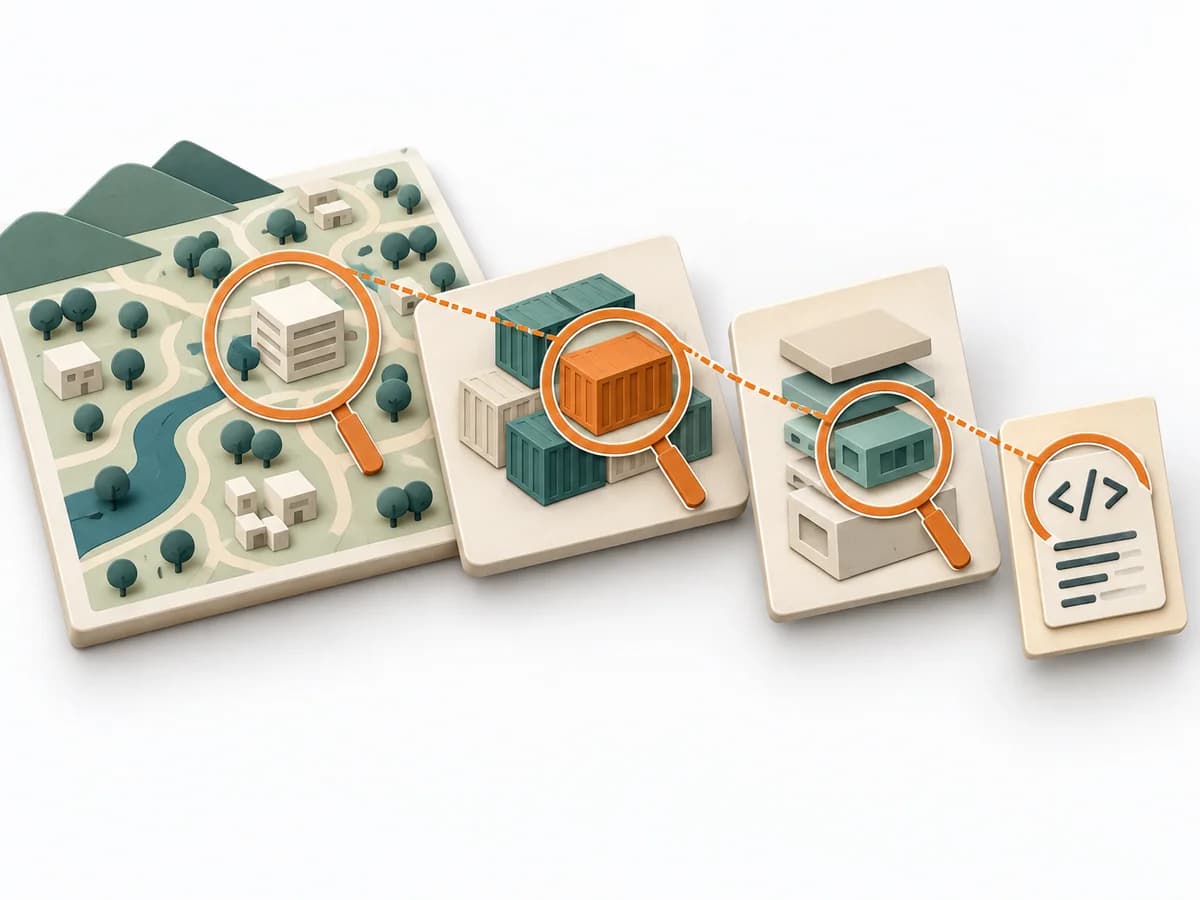 Architecture C4 Model |  Architecture Software Architecture Canvas |  UX Research Affinity Diagramming |
|---|---|---|---|---|
Purposedifferent | When a lot is assumed about a target group but little is seen jointly, empathy mapping makes knowledge and gaps directly comparable. The picture also shows which assumptions hold up and where evidence is missing. | The C4 Model makes a system legible across several resolution levels, from context down to code. It suits situations where different audiences need to understand the same architecture from different altitudes. | The Software Architecture Canvas reduces a system to the most important architecture decisions, constraints, and interfaces. It is useful when teams need a resilient overall picture quickly. | When research notes, feedback, or observations sit unconnected side by side, affinity diagramming sorts the raw material into solid themes. Many individual points turn into patterns that make decisions and opportunities clearer. |
Complexitysame | Low | Low | Low | Low |
Timedifferent | 30–60 min | 1-4 h | 1-2 h | 45–90 min |
Participantsdifferent | 4-8 | 1-5 | 3-10 | 3-10 |
Formatdifferent | Workshop | Workshop + async | Workshop | Workshop |
Outputdifferent | Empathy Map, Assumptions List, Research Gaps | Context Diagram, Container Diagram, Component Diagram | Architecture Canvas, Goals, Constraints, Quality Attributes | Theme clusters, Insight statements, Opportunity areas |
Tagsno overlap | SynthesisQualitativeWorkshop | ArchitectureCommunicationVisualization | CanvasArchitectureAlignmentWorkshop | SynthesisQualitativeRoot cause |