View methods side by side.
Choose up to four methods. Add them using the search and share the comparison by copying its link.
| Criterion |  Facilitation Dot Estimation |  Facilitation Stakeholder Mapping | 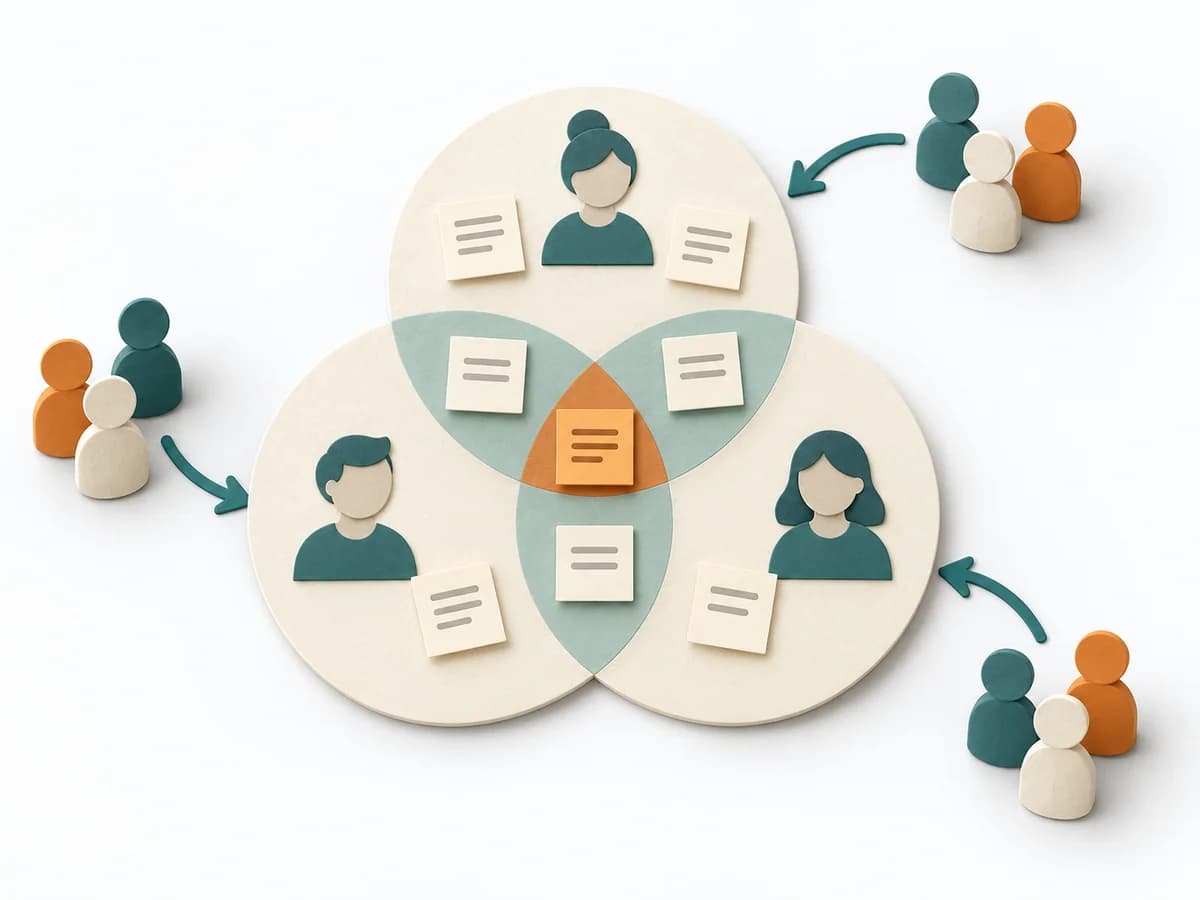 Facilitation 3-Circle Venn Diagram | 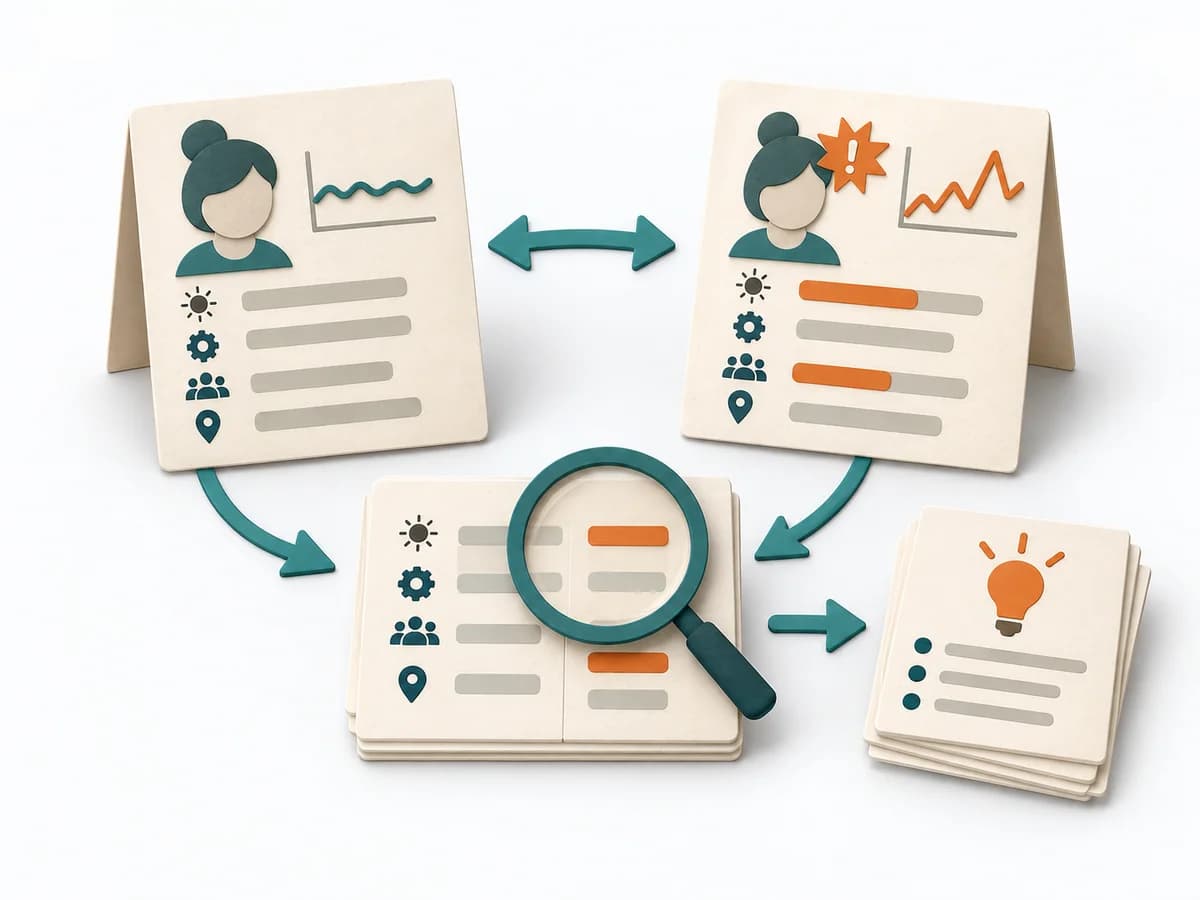 Operations Change Analysis |
|---|---|---|---|---|
Purposedifferent | When size or effort can only be estimated roughly, Dot Estimation condenses the group's experience into a quick range. It turns individual contributions into a visible selection. The result is captured as an Effort Heatmap, Risk Signals, and Discussion Targets. | When an initiative depends on many people, interests, and power dynamics, Stakeholder Mapping systematically orders the environment. It shows who influences, who is affected, and where relationship management or safeguarding matters first. | When three perspectives matter at the same time, a Three-Circle Venn Diagram shows the overlaps and remainders precisely. It makes visible where shared effect arises and where only a partial perspective applies. | For a deviation after a change, the method isolates the influence of the altered condition. It narrows down which differences are relevant and which are just accompanying noise. |
Complexitydifferent | Low | Low | Low | Medium |
Timedifferent | 5-20 min | 60–90 min | 15-45 min | 45-120 min |
Participantsdifferent | 3-20 | 2-8 | 2-8 | 2-6 |
Formatdifferent | Workshop | Workshop + async | Workshop + async | Workshop + async |
Outputdifferent | Effort Heatmap, Risk Signals, Discussion Targets | Stakeholder Map, Engagement Plan, Risk Notes | Venn Diagram, Overlap Notes, Differentiators | Change Matrix, Cause Hypotheses, Validation Questions, Action List |
Tagsno overlap | EstimationEffortRisk | StakeholdersAlignmentFacilitationChange | ComparisonFacilitationAlignment | ChangeRoot causeTroubleshootingComparison |