View methods side by side.
Choose up to four methods. Add them using the search and share the comparison by copying its link.
| Criterion | 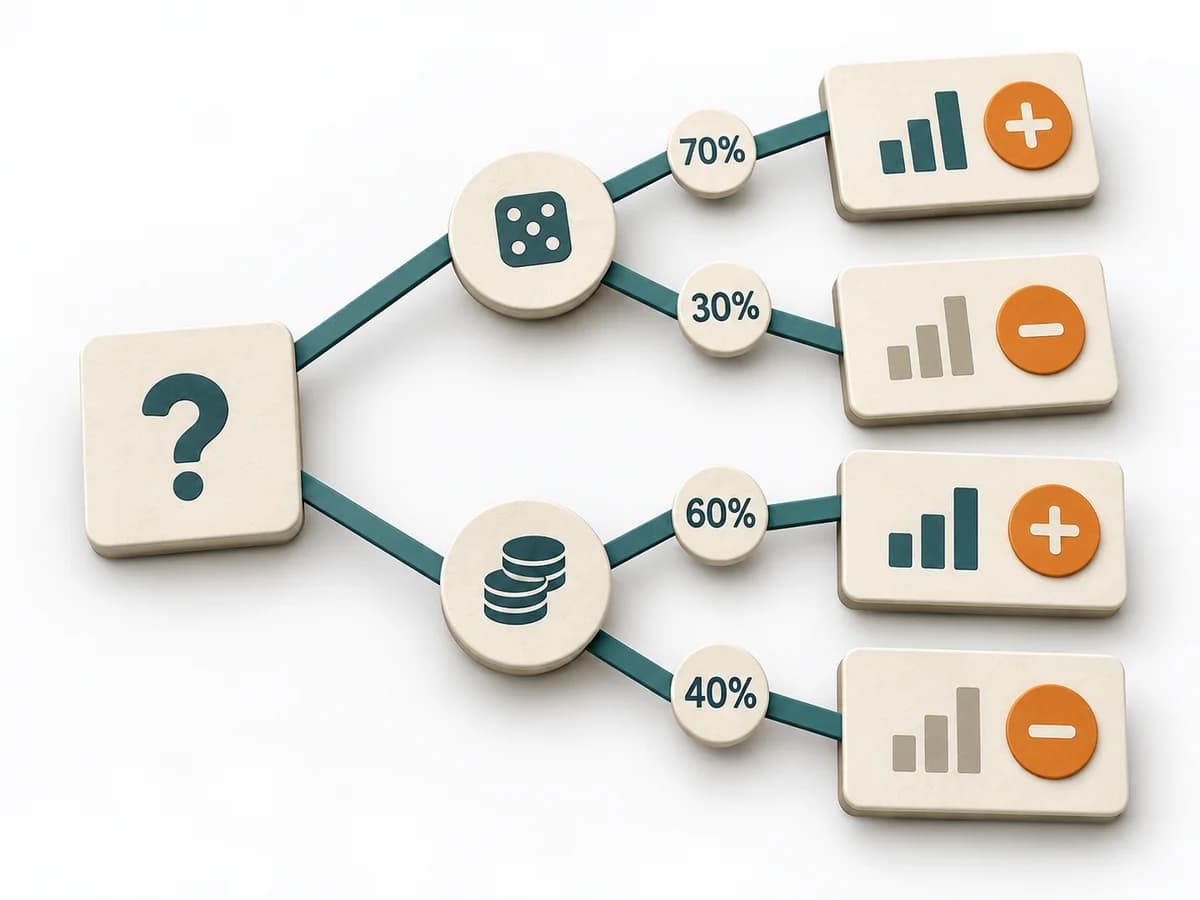 Decision Making Decision Tree |  Agile NoEstimates |  Facilitation Six Thinking Hats |  Delivery Monte Carlo Forecasting |
|---|---|---|---|---|
Purposedifferent | For decisions with follow-on paths and dependencies, a linear comparison is often not enough. A Decision Tree shows how options branch under conditions and which consequences hang on each branch. | When estimating slows a team down more than it helps, it shifts the focus to flow, small slices, and real lead time. It sorts work by value, risk, and delivery ability. The result is captured as Throughput Data, Flow Forecast, and Slicing Rules. | When a topic gets stuck too quickly in the same thinking mode, Six Thinking Hats deliberately separates the perspectives. This means facts, risks, creativity, and emotional signals get worked through one after another instead of mixed together. | Helps clarify scope, sequence, and delivery flow in concrete terms. It makes work, boundaries, and order steerable. The result is captured as Forecast Percentiles, Throughput Dataset, and Risk Communication. |
Complexitydifferent | Medium | Medium | Medium | High |
Timedifferent | 30-90 min | laufend | 45-90 min | 30-90 min Setup, danach laufend |
Participantsdifferent | 1-6 | 2-12 | 4-12 | 1-8 |
Formatdifferent | Workshop + async | Workshop + async | Workshop | Workshop + async |
Outputdifferent | Decision Tree, Option Map, Assumption List | Throughput Data, Flow Forecast, Slicing Rules | Perspective Notes, Decision Inputs, Action Items | Forecast Percentiles, Throughput Dataset, Risk Communication |
Tagsno overlap | DecisionTreeOptions | EstimationForecastingFlow | FacilitationOptionsDecision | ForecastingFlowDelivery |