View methods side by side.
Choose up to four methods. Add them using the search and share the comparison by copying its link.
| Criterion | 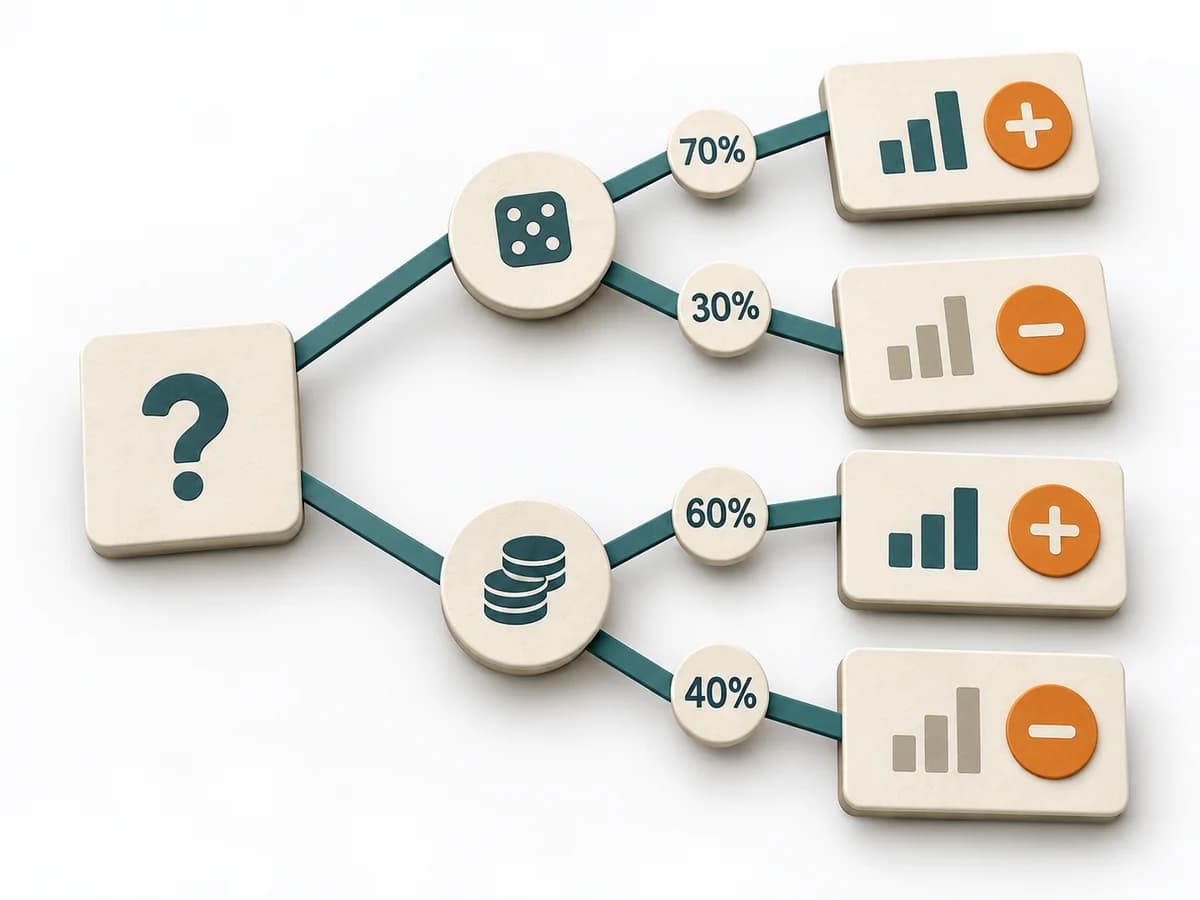 Decision Making Decision Tree |  Delivery Monte Carlo Forecasting | 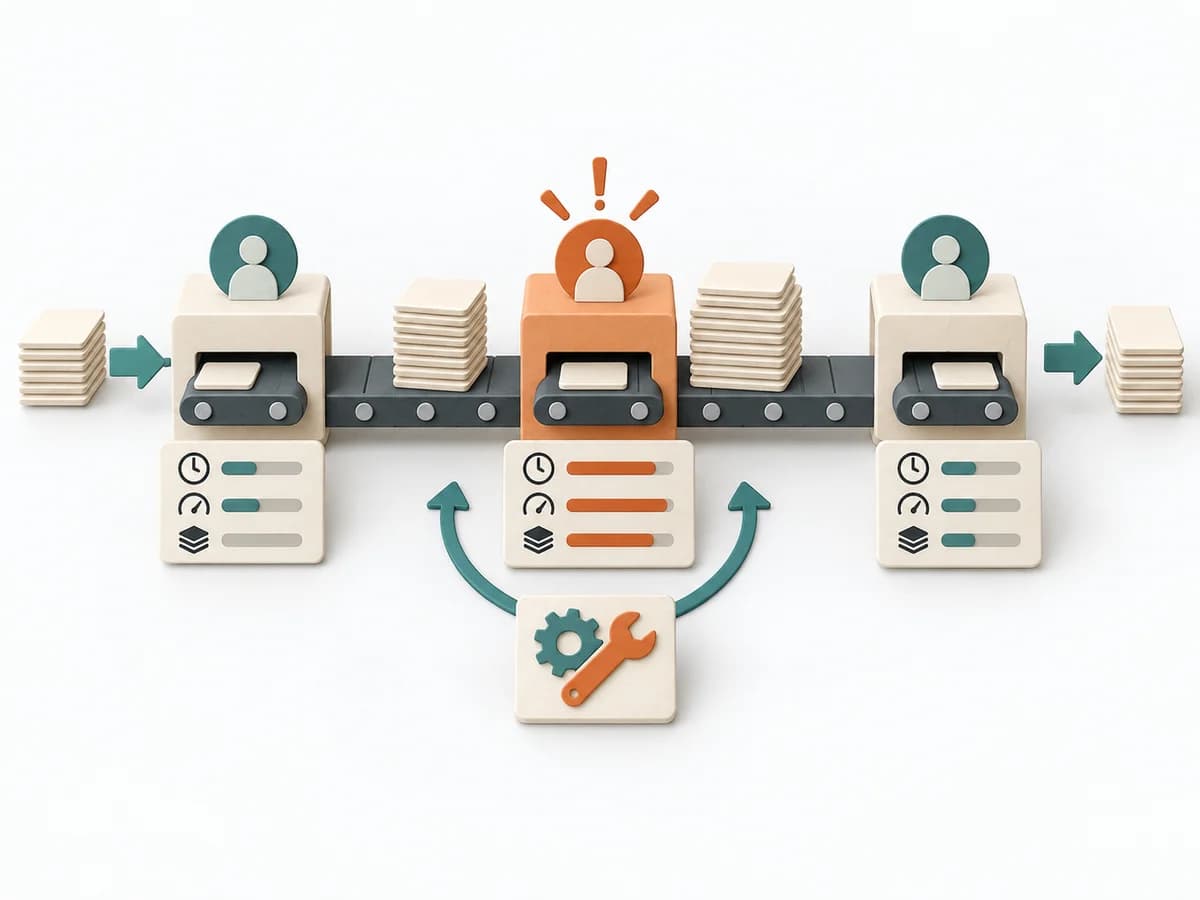 Operations Bottleneck Analysis | 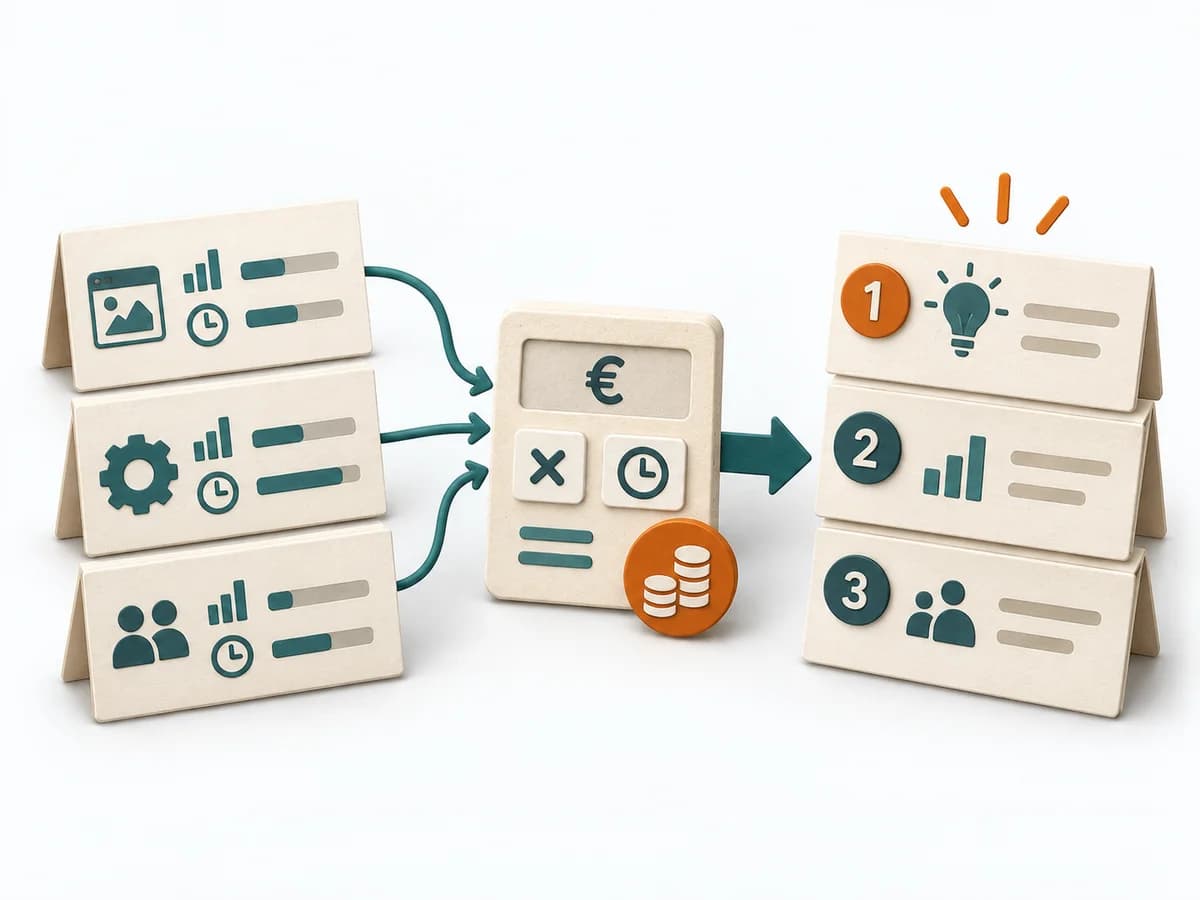 Delivery Cost of Delay |
|---|---|---|---|---|
Purposedifferent | For decisions with follow-on paths and dependencies, a linear comparison is often not enough. A Decision Tree shows how options branch under conditions and which consequences hang on each branch. | Helps clarify scope, sequence, and delivery flow in concrete terms. It makes work, boundaries, and order steerable. The result is captured as Forecast Percentiles, Throughput Dataset, and Risk Communication. | For a flow that backs up at one point, the method looks for the capacity limit with the greatest leverage. It explains why extra effort elsewhere barely improves throughput. | Helps clarify scope, order, and delivery flow in concrete terms. It makes work, constraints, and sequence manageable. The result is captured as a Cost of Delay table and prioritization sequence. |
Complexitydifferent | Medium | High | Medium | High |
Timedifferent | 30-90 min | 30-90 min Setup, danach laufend | 1-3 h | 90-180 min |
Participantsdifferent | 1-6 | 1-8 | 3-8 | 3-8 |
Formatdifferent | Workshop + async | Workshop + async | Workshop + async | Workshop |
Outputdifferent | Decision Tree, Option Map, Assumption List | Forecast Percentiles, Throughput Dataset, Risk Communication | Bottleneck Map, Flow Metrics, Improvement Options, Follow-up Measures | CoD Table, Prioritization Sequence |
Tagsno overlap | DecisionTreeOptions | ForecastingFlowDelivery | FlowMeasurementConstraints | PrioritizationDeliveryEconomicsDecision |