View methods side by side.
Choose up to four methods. Add them using the search and share the comparison by copying its link.
| Criterion |  UX Design Customer Journey Canvas | 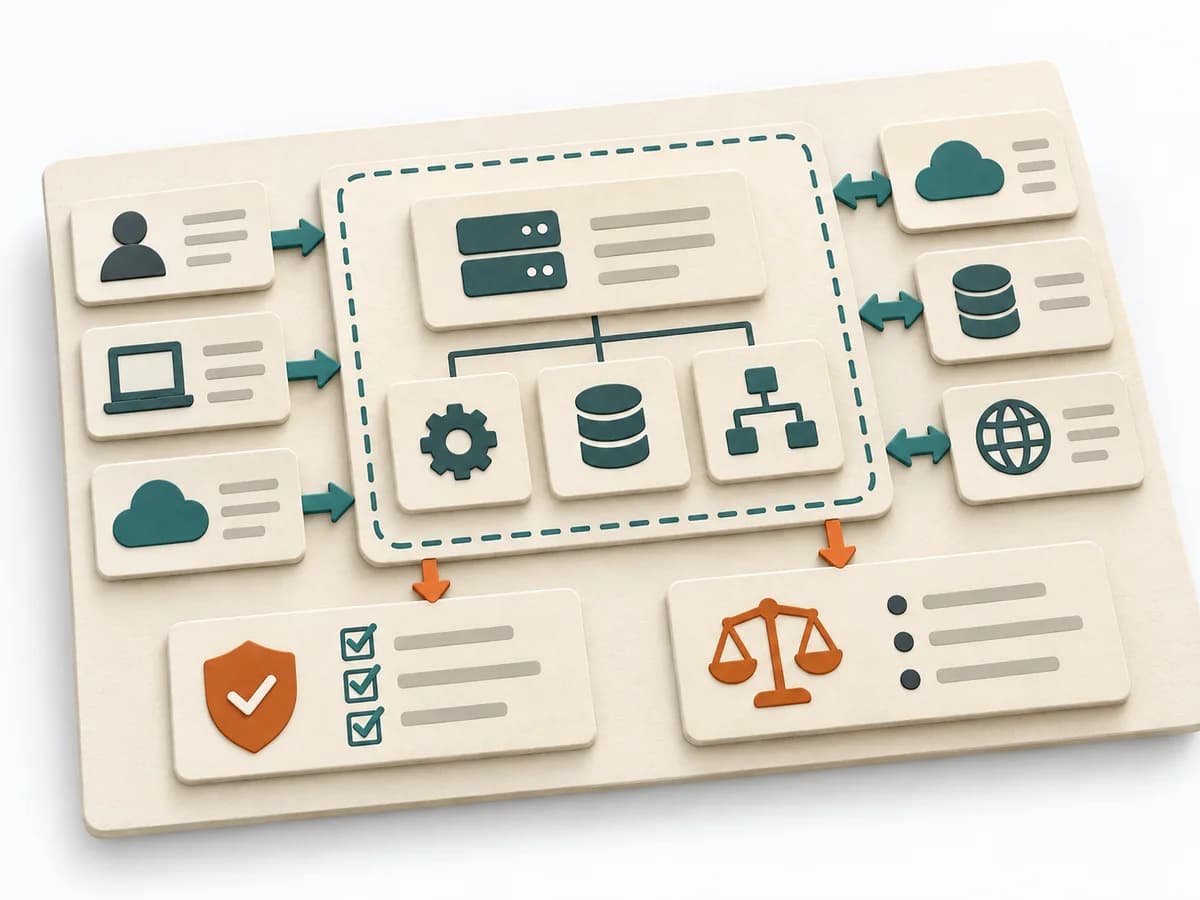 Architecture Software Architecture Canvas |  Product Strategy KPI Tree | 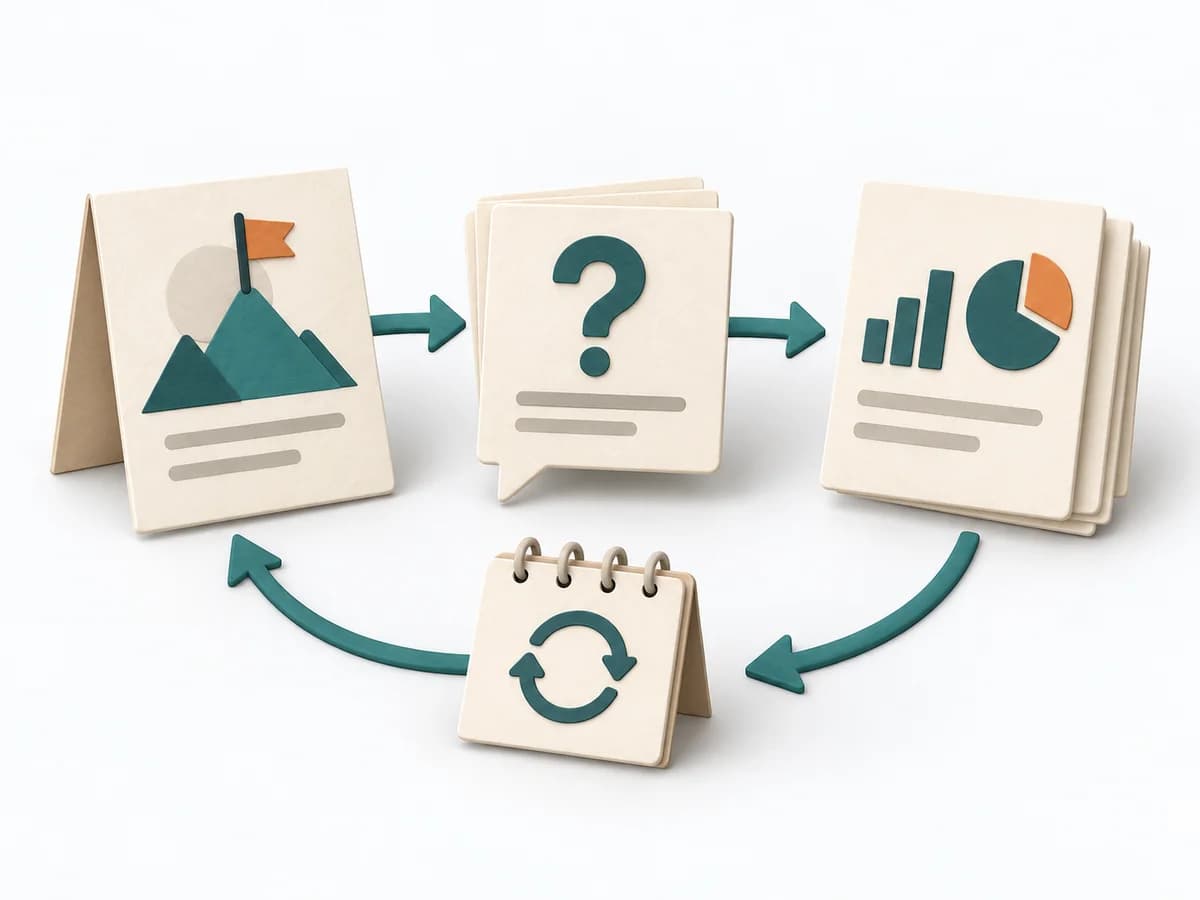 Engineering Goal Question Metric |
|---|---|---|---|---|
Purposedifferent | When a journey needs to be understood across several phases, it arranges experience, touchpoints, and opportunities into one picture. It makes gaps and friction along the user path clear. | The Software Architecture Canvas reduces a system to the most important architecture decisions, constraints, and interfaces. It is useful when teams need a resilient overall picture quickly. | When metrics across the organization drift apart, it arranges drivers and effects under one shared logic. It connects customer value, product logic, and decision priorities. The result is captured as a KPI tree and owner list. | Helps clarify technical problems, hypotheses, and next steps in concrete terms. It breaks a technical problem into testable parts. The result is captured as a GQM table and metric briefs. |
Complexitydifferent | Medium | Low | Medium | Medium |
Timedifferent | 1-3 h | 1-2 h | 90-180 min initial, dann laufend | 90-180 min |
Participantsdifferent | 3-10 | 3-10 | 3-8 | 3-6 |
Formatdifferent | Workshop | Workshop | Workshop + async | Workshop |
Outputdifferent | Customer Journey Canvas, Pain Points, Experience Opportunities | Architecture Canvas, Goals, Constraints, Quality Attributes | KPI Tree, Owner List | GQM Table, Metric Profiles |
Tagsno overlap | JourneyCustomerService designCanvas | CanvasArchitectureAlignmentWorkshop | MetricsStrategyAlignmentMeasurement | MetricsMeasurementEngineeringAlignment |