View methods side by side.
Choose up to four methods. Add them using the search and share the comparison by copying its link.
| Criterion | 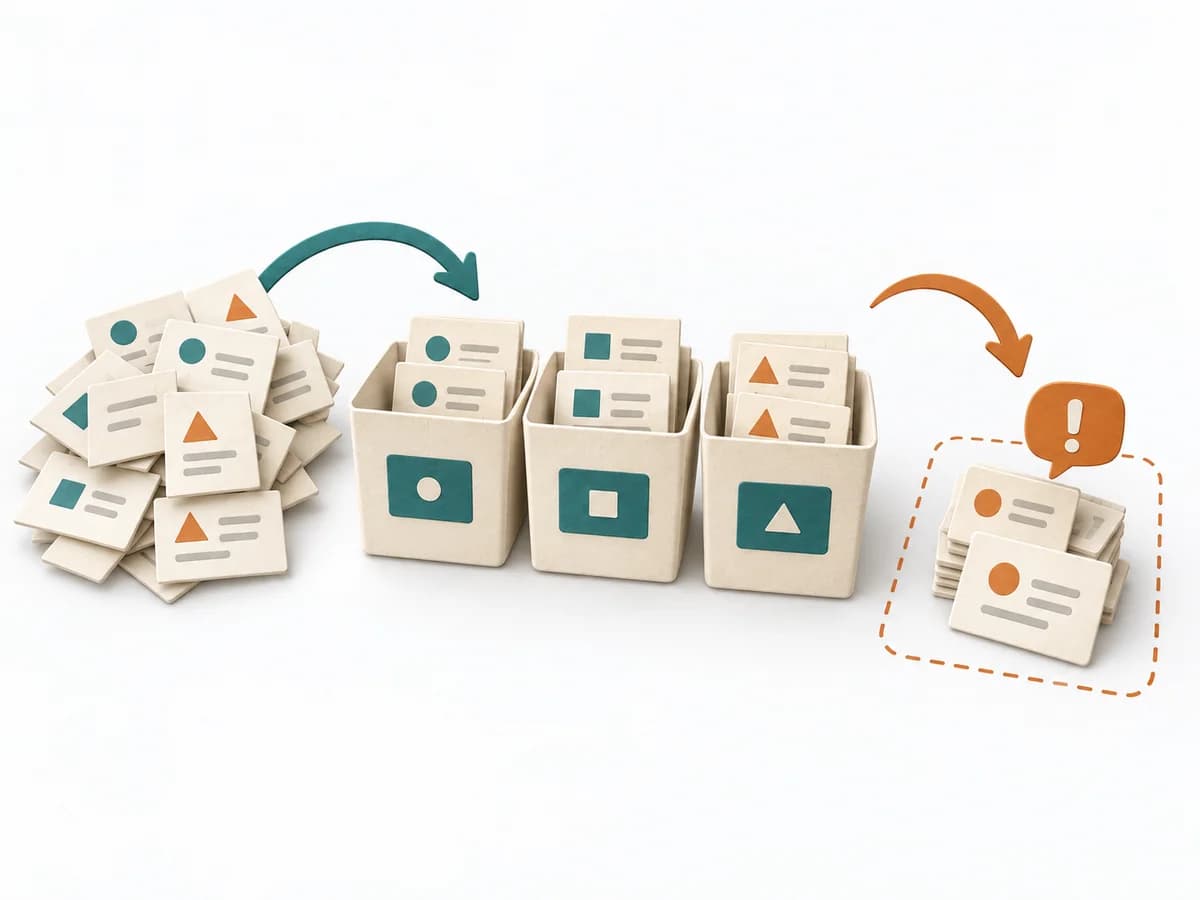 Agile Bucket System | 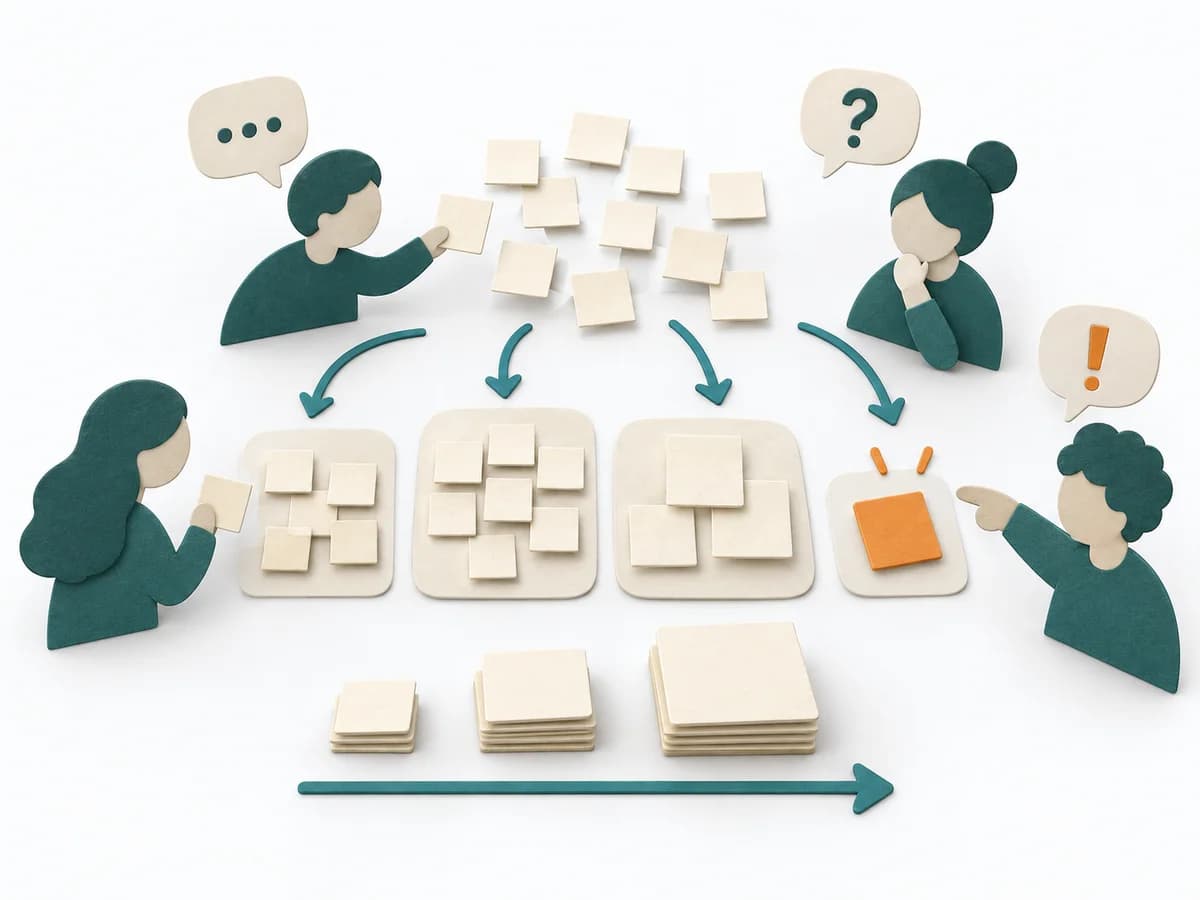 Agile Affinity Estimation |  Operations 8D Problem Solving |  Operations Fishbone Diagram |
|---|---|---|---|---|
Purposedifferent | When a large batch of work needs a fast, rough estimate, it sorts items into predefined size buckets. It sorts work by value, risk, and delivery ability. The result is captured as a Bucketed Backlog, Relative Estimates, and Split Candidates. | When many tasks need to be classified quickly, it sorts them by perceived effort and similarity. It reduces the effort of fine-grained estimation for large volumes. | For an acute quality or delivery problem, the method structures immediate protection and root cause work together. It keeps the situation stable while the actual cause is investigated cleanly. | When a problem has several possible contributing factors, the method sorts causes by cause areas. It prevents an initial hunch from blocking the view of other plausible drivers. |
Complexitydifferent | Medium | Medium | High | Low |
Timedifferent | 30-90 min | 30-90 min | 1-6 Wochen | 30-60 min |
Participantsdifferent | 3-12 | 3-12 | 4-10 | 2-8 |
Formatdifferent | Workshop | Workshop | Workshop + async | Workshop |
Outputdifferent | Bucketed Backlog, Relative Estimates, Split Candidates | Affinity Size Map, Grouped Estimates, Unclear Items | 8D Report, Containment Plan, Root Cause Evidence, Corrective Action Plan | Fishbone Diagram, Cause Categories, Investigation Backlog |
Tagsno overlap | EstimationBacklogRelative sizing | EstimationBacklogRelative sizing | QualityProblem solvingRoot cause | Root causeQualityOperations |