View methods side by side.
Choose up to four methods. Add them using the search and share the comparison by copying its link.
| Criterion | 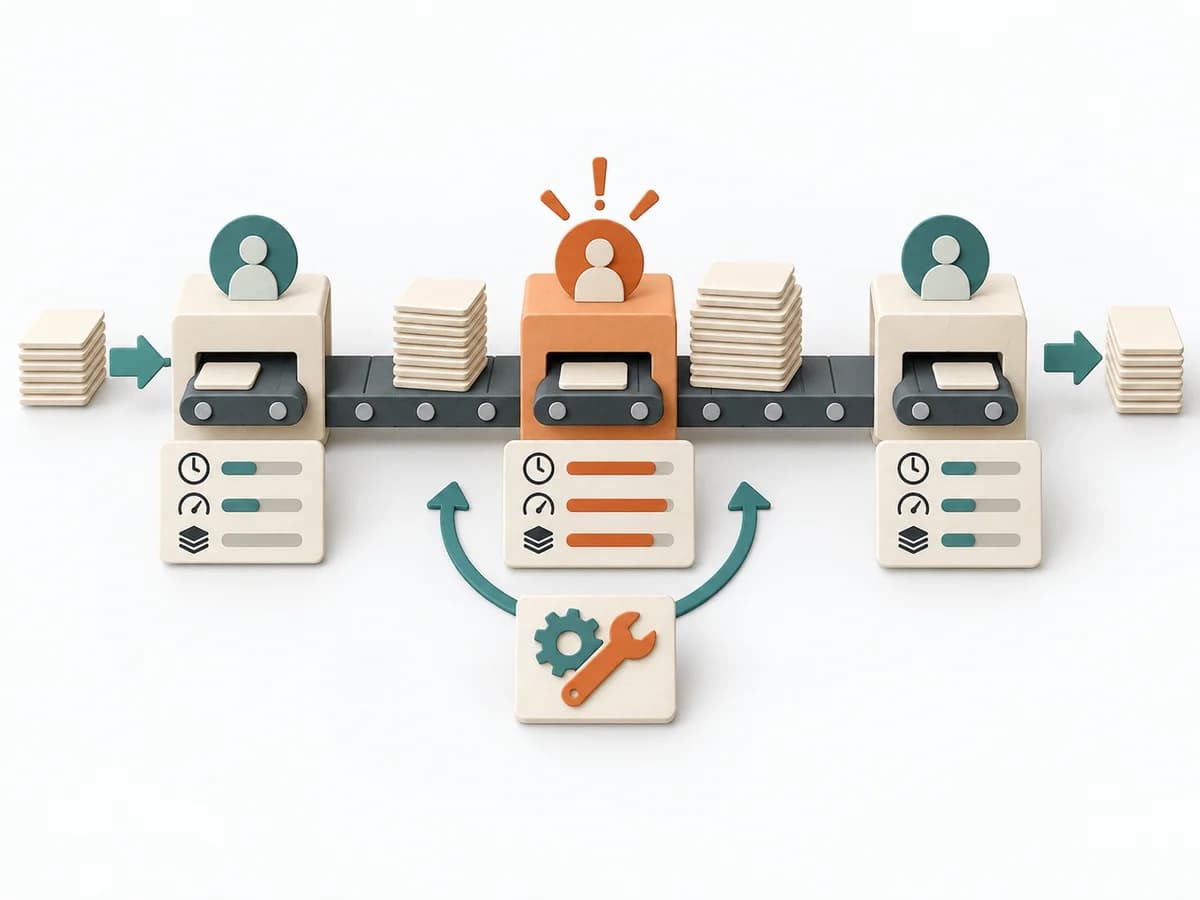 Operations Bottleneck Analysis | 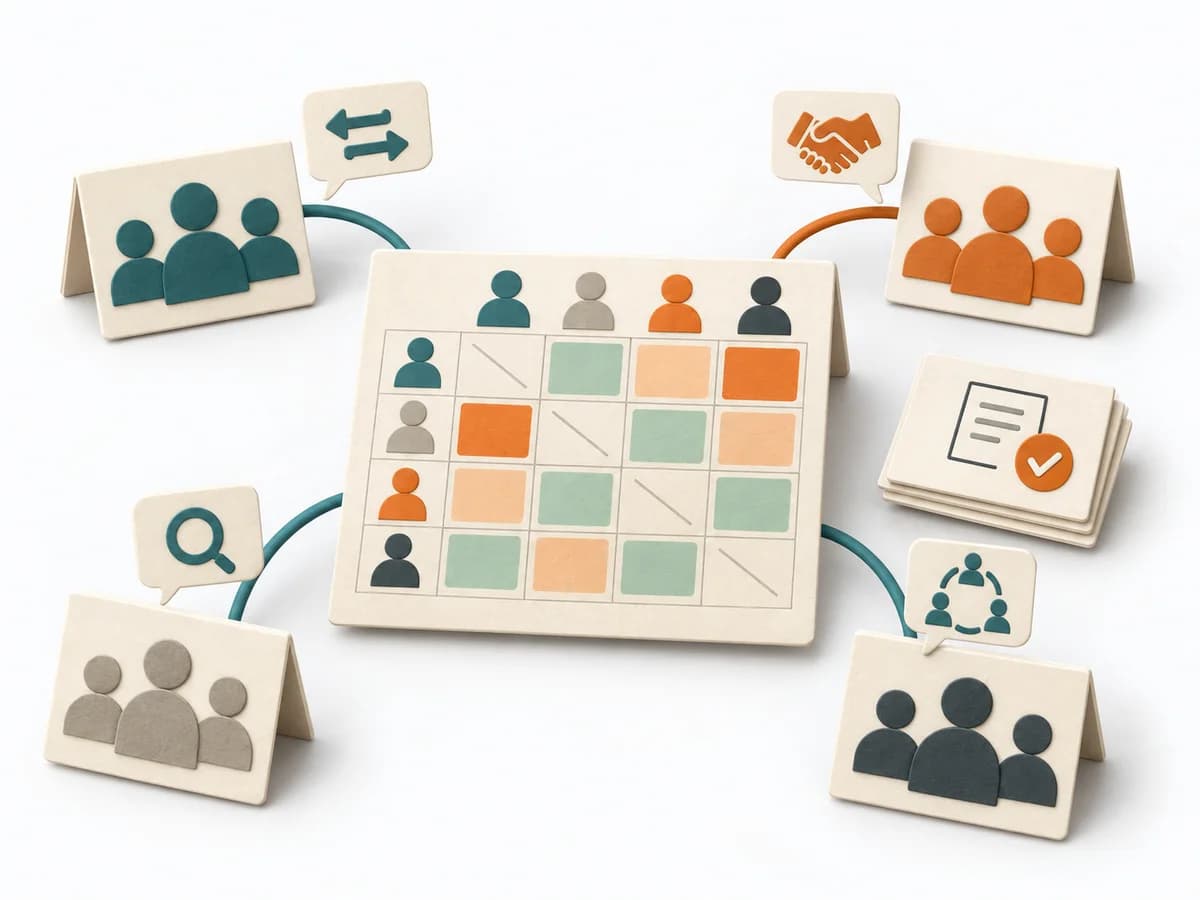 Team Design Team Topologies Interaction Modes |  Product Strategy KPI Tree | 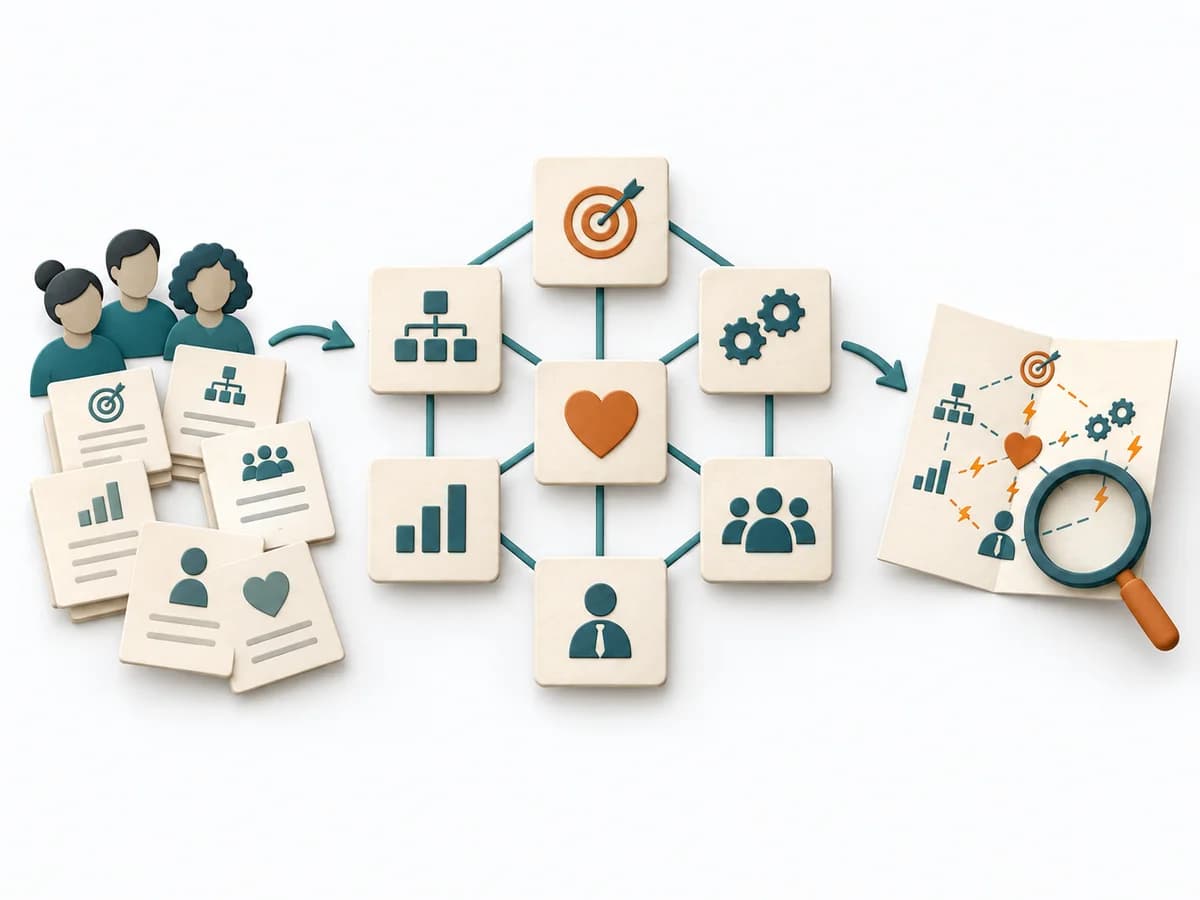 Business Strategy McKinsey 7S |
|---|---|---|---|---|
Purposedifferent | For a flow that backs up at one point, the method looks for the capacity limit with the greatest leverage. It explains why extra effort elsewhere barely improves throughput. | When several teams collaborate repeatedly, it describes the right interaction mode for each interface between them. It clarifies responsibility, interaction, and load between teams. The result is captured as an interaction heat map and pairwise agreements. | When metrics across the organization drift apart, it arranges drivers and effects under one shared logic. It connects customer value, product logic, and decision priorities. The result is captured as a KPI tree and owner list. | McKinsey 7S checks whether Strategy, Structure, Systems, Shared Values, Skills, Style, and Staff fit together. Organizational misalignments become visible across multiple levers as a result. |
Complexitysame | Medium | Medium | Medium | Medium |
Timedifferent | 1-3 h | Half day | 90-180 min initial, dann laufend | 2-4 h |
Participantsdifferent | 3-8 | Team-Leads plus Architecture | 3-8 | 3-12 |
Formatdifferent | Workshop + async | Workshop | Workshop + async | Workshop |
Outputdifferent | Bottleneck Map, Flow Metrics, Improvement Options, Follow-up Measures | Interaction Heat Map, Agreements per Pair | KPI Tree, Owner List | 7S Assessment, Alignment Gaps, Change Actions |
Tagsno overlap | FlowMeasurementConstraints | TeamAlignmentCollaborationOrganization | MetricsStrategyAlignmentMeasurement | OrganizationStrategyAlignmentChange |