View methods side by side.
Choose up to four methods. Add them using the search and share the comparison by copying its link.
| Criterion | 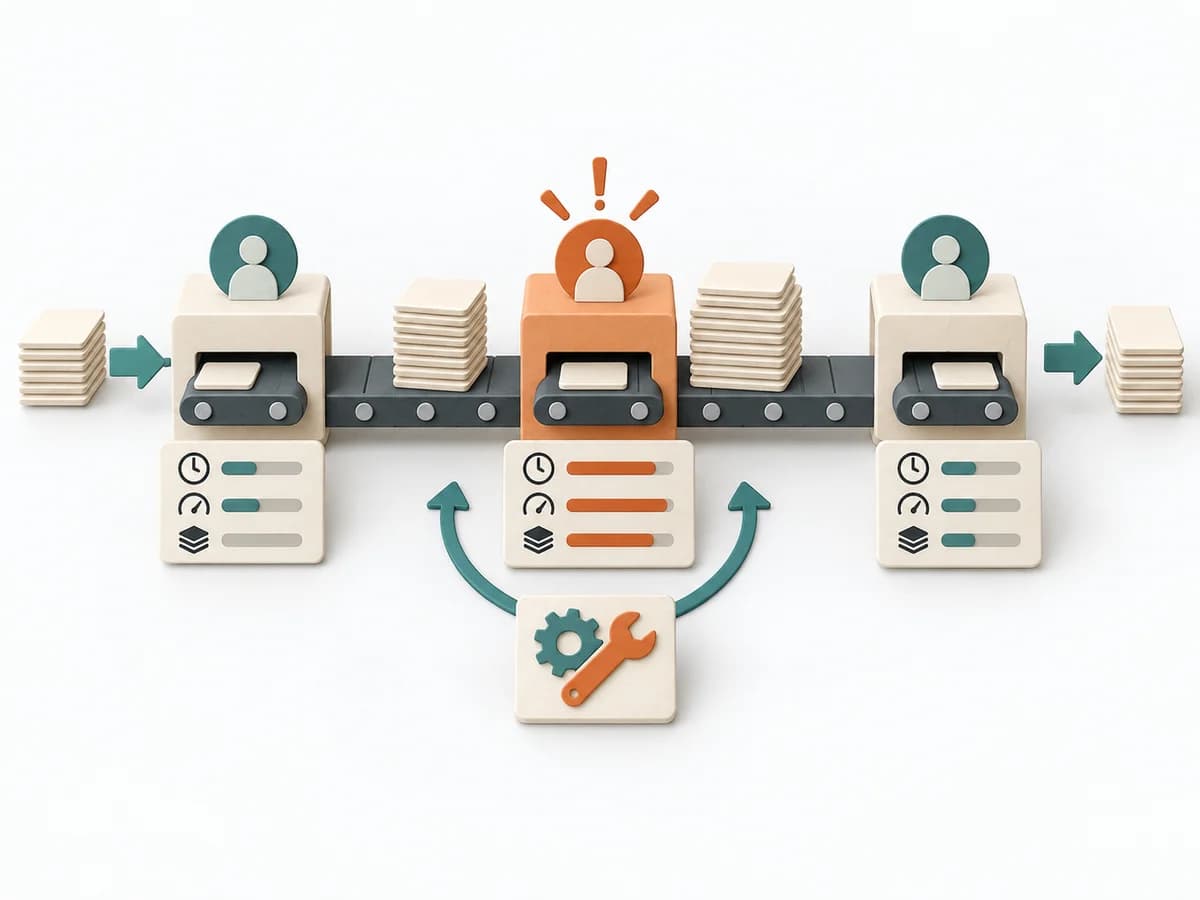 Operations Bottleneck Analysis | 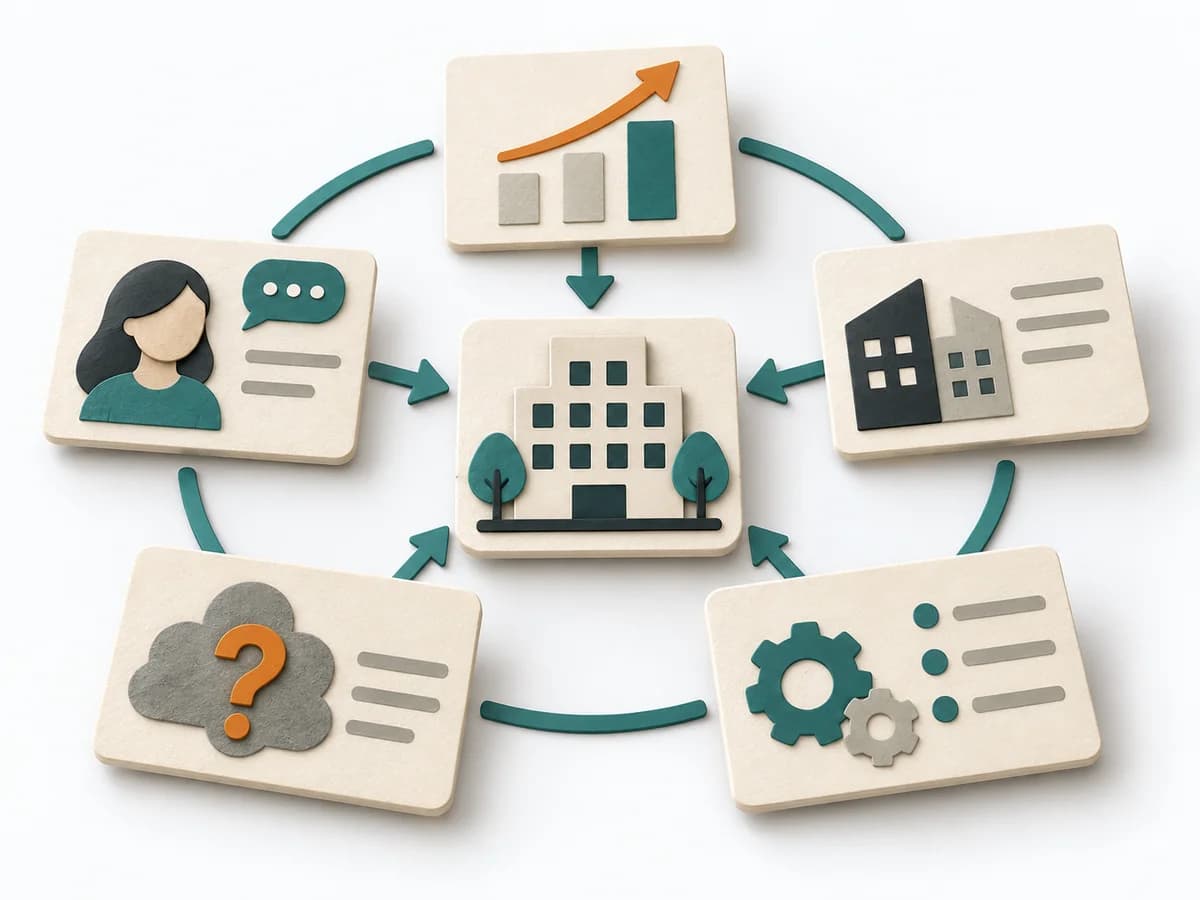 Product Discovery Context Canvas | 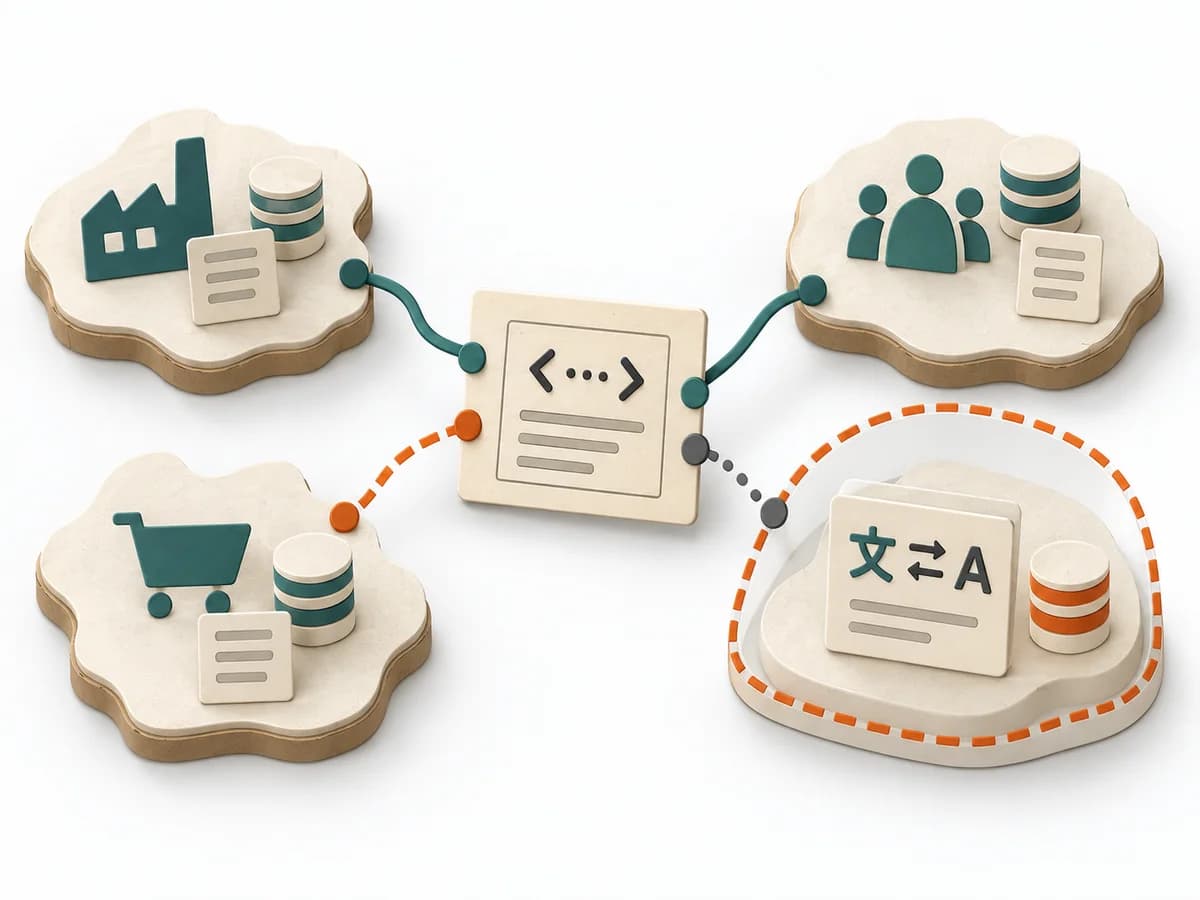 Domain Modeling Context Map |  Product Strategy KPI Tree |
|---|---|---|---|---|
Purposedifferent | For a flow that backs up at one point, the method looks for the capacity limit with the greatest leverage. It explains why extra effort elsewhere barely improves throughput. | When an environment of users, systems, and constraints is hard to grasp, it puts the context compactly on the table. It creates a clear reading of influence, boundary, and dependency. | When several contexts need to talk to each other, it makes their relationships and dependencies legible. It helps sort integration pressure and responsibilities across system boundaries. | When metrics across the organization drift apart, it arranges drivers and effects under one shared logic. It connects customer value, product logic, and decision priorities. The result is captured as a KPI tree and owner list. |
Complexitydifferent | Medium | Low | Medium | Medium |
Timedifferent | 1-3 h | 45-90 min | 1-3 h | 90-180 min initial, dann laufend |
Participantsdifferent | 3-8 | 3-10 | 2-8 | 3-8 |
Formatdifferent | Workshop + async | Workshop | Workshop + async | Workshop + async |
Outputdifferent | Bottleneck Map, Flow Metrics, Improvement Options, Follow-up Measures | Context canvas, Open questions, Shared context notes | Context Map, Integration Patterns, Boundary Notes | KPI Tree, Owner List |
Tagsno overlap | FlowMeasurementConstraints | ContextFramingRequirementsCanvas | Domain-Driven DesignBoundariesStrategy | MetricsStrategyAlignmentMeasurement |