View methods side by side.
Choose up to four methods. Add them using the search and share the comparison by copying its link.
Selected:Assumption SurfacingLASR (Lightweight Approach for Software Reviews)Fishbone DiagramFailure Mode and Effects Analysis
| Criterion | 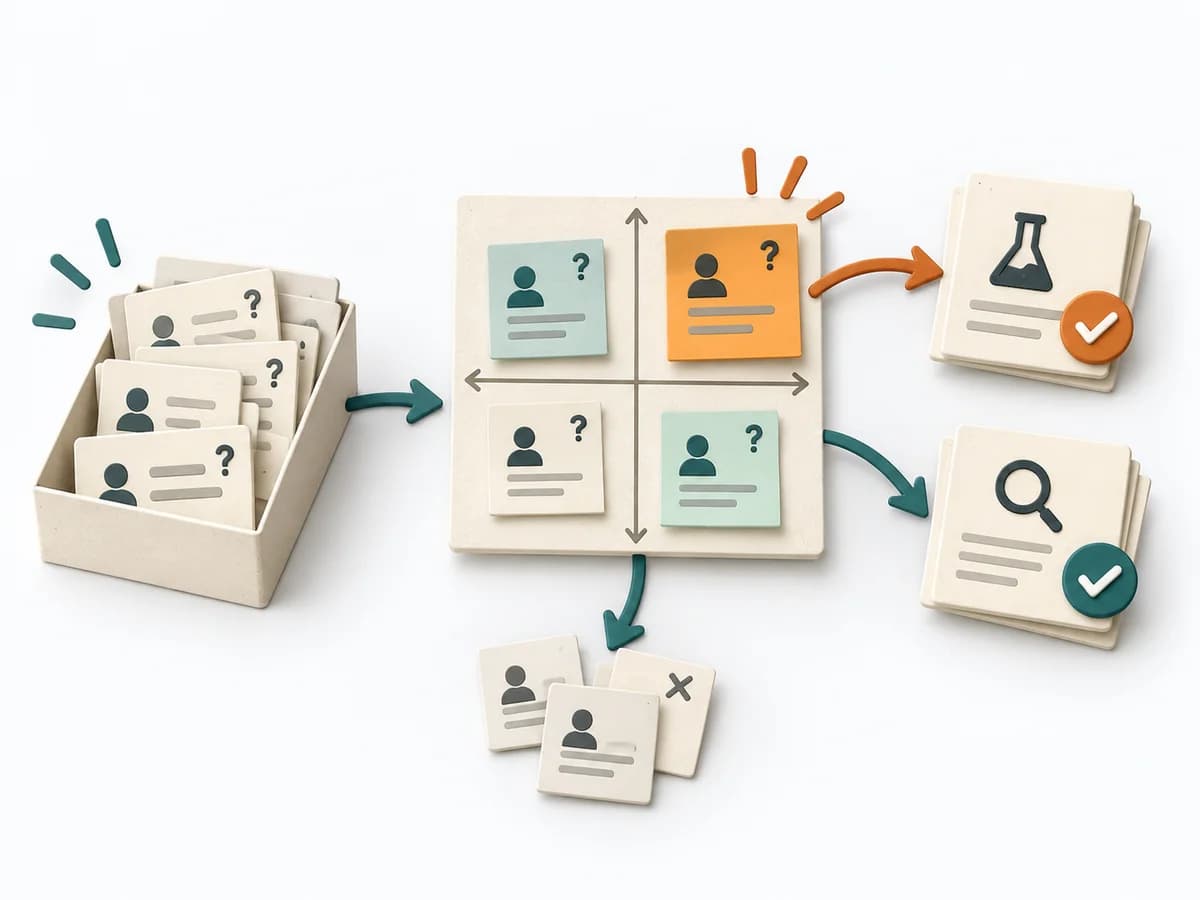 Decision Making Assumption Surfacing |  Architecture LASR (Lightweight Approach for Software Reviews) |  Operations Fishbone Diagram |  Operations Failure Mode and Effects Analysis |
|---|---|---|---|---|
Purposedifferent | Plans often contain assumptions that were never openly stated and remain dangerous precisely because of that. Assumption Surfacing makes these silent premises visible and prioritizes which of them carry the initiative or could sink it. | LASR helps development teams identify where their software falls short of important quality goals and which improvements to consider. A small group with existing system knowledge can make an initial assessment and investigate open questions in more detail. | When a problem has several possible contributing factors, the method sorts causes by cause areas. It prevents an initial hunch from blocking the view of other plausible drivers. | For a process, product, or service with noticeable failure risks, the method assesses possible failure modes in advance. It directs attention to combinations of occurrence, effect, and detectability. |
Complexitydifferent | Low | Medium | Low | High |
Timedifferent | 45-90 min | 3–4 h for initial assessment; preparation and deeper analysis additional | 30-60 min | 2-6 h |
Participantsdifferent | 2-8 | 1 or a small team; particularly suitable for 3–4 people | 2-8 | 3-10 |
Formatdifferent | Workshop + async | Workshop + async | Workshop | Workshop |
Outputdifferent | Assumption List, Critical Assumptions, Learning Plan | Lean Mission Statement describing the software’s purpose, Prioritized quality goals and evaluation criteria, Risks and estimated gaps against quality goals, More closely examined findings and open checks | Fishbone Diagram, Cause Categories, Investigation Backlog | FMEA Table, Risk Priority, Mitigation Actions |
Tagsno overlap | AssumptionsRiskDecisionDiscovery | ArchitectureQualityRiskAssessmentLean | Root causeQualityOperations | RiskQualityOperationsRoot cause |