View methods side by side.
Choose up to four methods. Add them using the search and share the comparison by copying its link.
| Criterion |  Business Strategy Ansoff Matrix |  Agile Ideal Days | 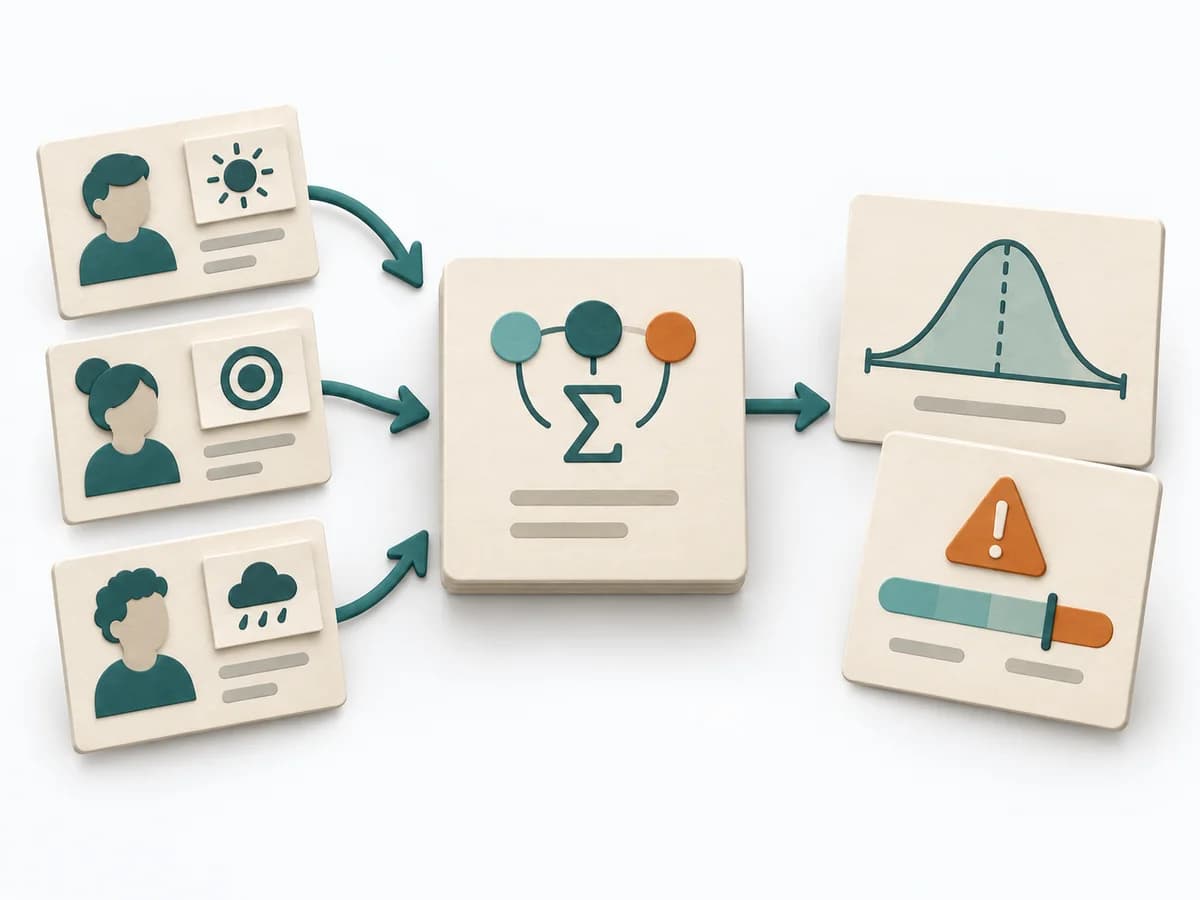 Decision Making PERT Estimation |  Facilitation Dot Estimation |
|---|---|---|---|---|
Purposedifferent | The Ansoff Matrix organizes growth options by market and product relation. It helps weigh expansion, diversification, and adaptation cleanly against each other. | When effort needs to be thought of as real working time, it offers a simple common denominator for comparison. It sorts work by value, risk, and delivery ability. The result is captured as Ideal Day Estimates, Assumption Notes, and Capacity Caveats. | On complex initiatives, a plain average tends to understate just how uncertain the outcome really is. It separates options, evaluation criteria, and open risks. The result is captured as a PERT Estimate, Expected Value, and Risk Notes. | When size or effort can only be estimated roughly, Dot Estimation condenses the group's experience into a quick range. It turns individual contributions into a visible selection. The result is captured as an Effort Heatmap, Risk Signals, and Discussion Targets. |
Complexitydifferent | Low | Low | Medium | Low |
Timedifferent | 45-90 min | 15-60 min | 15-45 min | 5-20 min |
Participantsdifferent | 2-8 | 2-9 | 1-8 | 3-20 |
Formatdifferent | Workshop + async | Workshop + async | Workshop + async | Workshop |
Outputdifferent | Ansoff Matrix, Growth Options, Risk Notes | Ideal Day Estimates, Assumption Notes, Capacity Caveats | PERT Estimate, Expected Value, Risk Notes | Effort Heatmap, Risk Signals, Discussion Targets |
Tagsno overlap | GrowthStrategyMarketPortfolio | EstimationEffortAgile | EstimationUncertaintyRisk | EstimationEffortRisk |