View methods side by side.
Choose up to four methods. Add them using the search and share the comparison by copying its link.
| Criterion |  UX Research Affinity Diagramming | 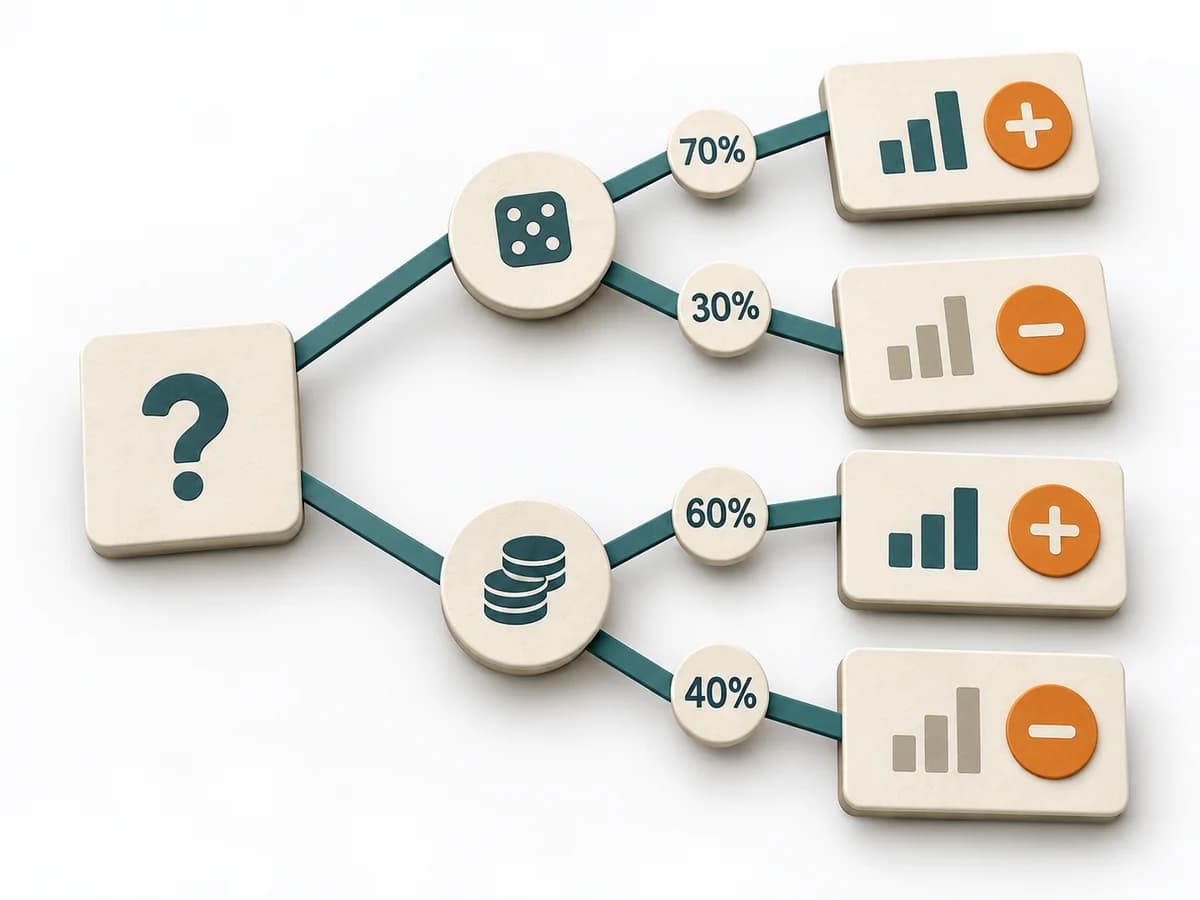 Decision Making Decision Tree |  Operations Root Cause Analysis |  Operations 8D Problem Solving |
|---|---|---|---|---|
Purposedifferent | When research notes, feedback, or observations sit unconnected side by side, affinity diagramming sorts the raw material into solid themes. Many individual points turn into patterns that make decisions and opportunities clearer. | For decisions with follow-on paths and dependencies, a linear comparison is often not enough. A Decision Tree shows how options branch under conditions and which consequences hang on each branch. | When a problem keeps recurring and the cause stays unclear, the method exposes the underlying mechanism. It separates symptom, guess, and robust explanation from one another. | For an acute quality or delivery problem, the method structures immediate protection and root cause work together. It keeps the situation stable while the actual cause is investigated cleanly. |
Complexitydifferent | Low | Medium | Medium | High |
Timedifferent | 45–90 min | 30-90 min | 1-4 h | 1-6 Wochen |
Participantsdifferent | 3-10 | 1-6 | 3-8 | 4-10 |
Formatdifferent | Workshop | Workshop + async | Workshop + async | Workshop + async |
Outputdifferent | Theme clusters, Insight statements, Opportunity areas | Decision Tree, Option Map, Assumption List | Problem Statement, Cause Hypotheses, Confirmed Causes, Action Plan | 8D Report, Containment Plan, Root Cause Evidence, Corrective Action Plan |
Tagsno overlap | SynthesisQualitativeRoot cause | DecisionTreeOptions | Root causeProblem solvingQualityIncident | QualityProblem solvingRoot cause |