View methods side by side.
Choose up to four methods. Add them using the search and share the comparison by copying its link.
| Criterion |  UX Research Affinity Diagramming |  Facilitation Alignment Mapping |  Facilitation Stakeholder Mapping | 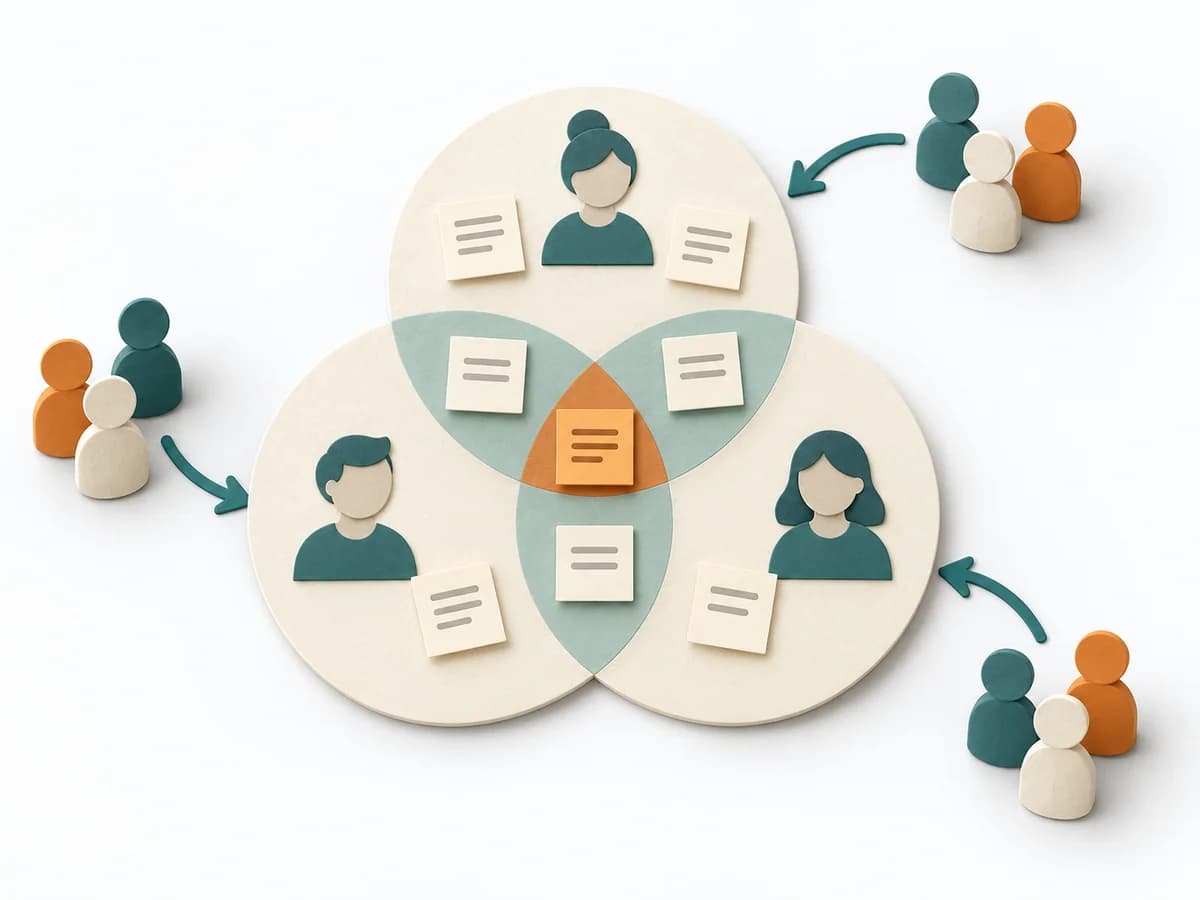 Facilitation 3-Circle Venn Diagram |
|---|---|---|---|---|
Purposedifferent | When research notes, feedback, or observations sit unconnected side by side, affinity diagramming sorts the raw material into solid themes. Many individual points turn into patterns that make decisions and opportunities clearer. | When several people work toward one goal but hold different mental maps, Alignment Mapping makes the discrepancies visible. It arranges goals, assumptions, and priorities so shared direction becomes verifiable. | When an initiative depends on many people, interests, and power dynamics, Stakeholder Mapping systematically orders the environment. It shows who influences, who is affected, and where relationship management or safeguarding matters first. | When three perspectives matter at the same time, a Three-Circle Venn Diagram shows the overlaps and remainders precisely. It makes visible where shared effect arises and where only a partial perspective applies. |
Complexitydifferent | Low | Medium | Low | Low |
Timedifferent | 45–90 min | 1-2 h | 60–90 min | 15-45 min |
Participantsdifferent | 3-10 | 4-12 | 2-8 | 2-8 |
Formatdifferent | Workshop | Workshop | Workshop + async | Workshop + async |
Outputdifferent | Theme clusters, Insight statements, Opportunity areas | Alignment Map, Open Issues, Decision Questions | Stakeholder Map, Engagement Plan, Risk Notes | Venn Diagram, Overlap Notes, Differentiators |
Tagsno overlap | SynthesisQualitativeRoot cause | AlignmentStakeholdersStrategyFacilitation | StakeholdersAlignmentFacilitationChange | ComparisonFacilitationAlignment |