View methods side by side.
Choose up to four methods. Add them using the search and share the comparison by copying its link.
| Criterion |  Operations Visual Management |  Product Strategy ICE Scoring | 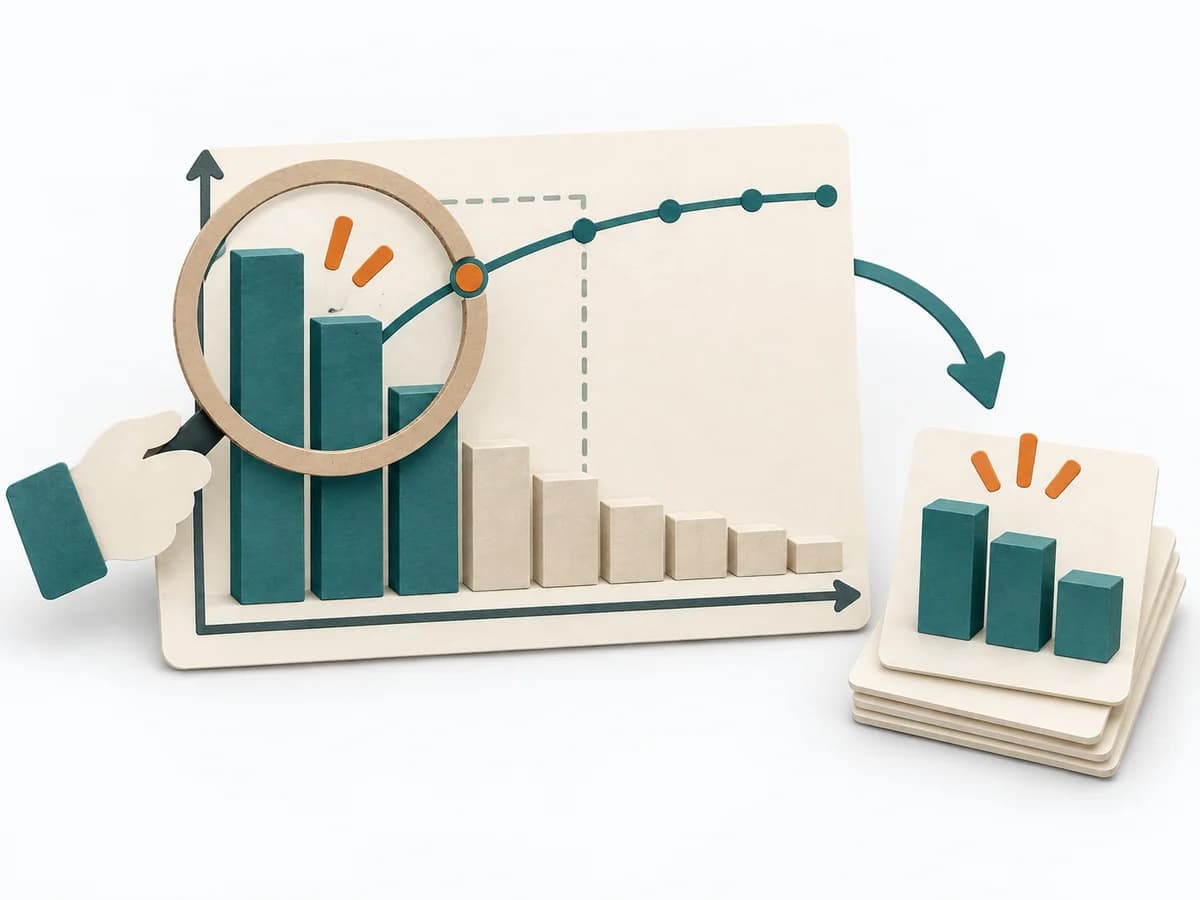 Decision Making Pareto Analysis |  Operations Fishbone Diagram |
|---|---|---|---|---|
Purposedifferent | With high tempo and many parallel topics, the method makes status, deviations, and priorities visible at a glance. It reduces search effort and prevents what matters from getting lost in daily work. | When ideas need sorting quickly, it condenses impact, confidence, and effort into one compact score. It connects customer value, product logic, and decision priorities. The result is captured as an ICE table and top-ideas list. | In many problem situations, effect is distributed unequally across many causes. A Pareto Analysis separates the few drivers with high leverage from the long remainder and focuses attention on what measurably moves the needle. | When a problem has several possible contributing factors, the method sorts causes by cause areas. It prevents an initial hunch from blocking the view of other plausible drivers. |
Complexitysame | Low | Low | Low | Low |
Timedifferent | Ongoing | 30-60 min | 30-60 min | 30-60 min |
Participantsdifferent | 1-20 | 2-8 | 1-6 | 2-8 |
Formatdifferent | Workshop + async | Workshop + async | Workshop + async | Workshop |
Outputdifferent | Visual Board, Status Indicators, Exception Cues | ICE Table, Top Idea List | Pareto Chart, Top Causes, Focus List | Fishbone Diagram, Cause Categories, Investigation Backlog |
Tagsno overlap | SignalsOperationsVisual management | PrioritizationScoringGrowthDecision | PrioritizationQualityFocusRoot cause | Root causeQualityOperations |