View methods side by side.
Choose up to four methods. Add them using the search and share the comparison by copying its link.
| Criterion | 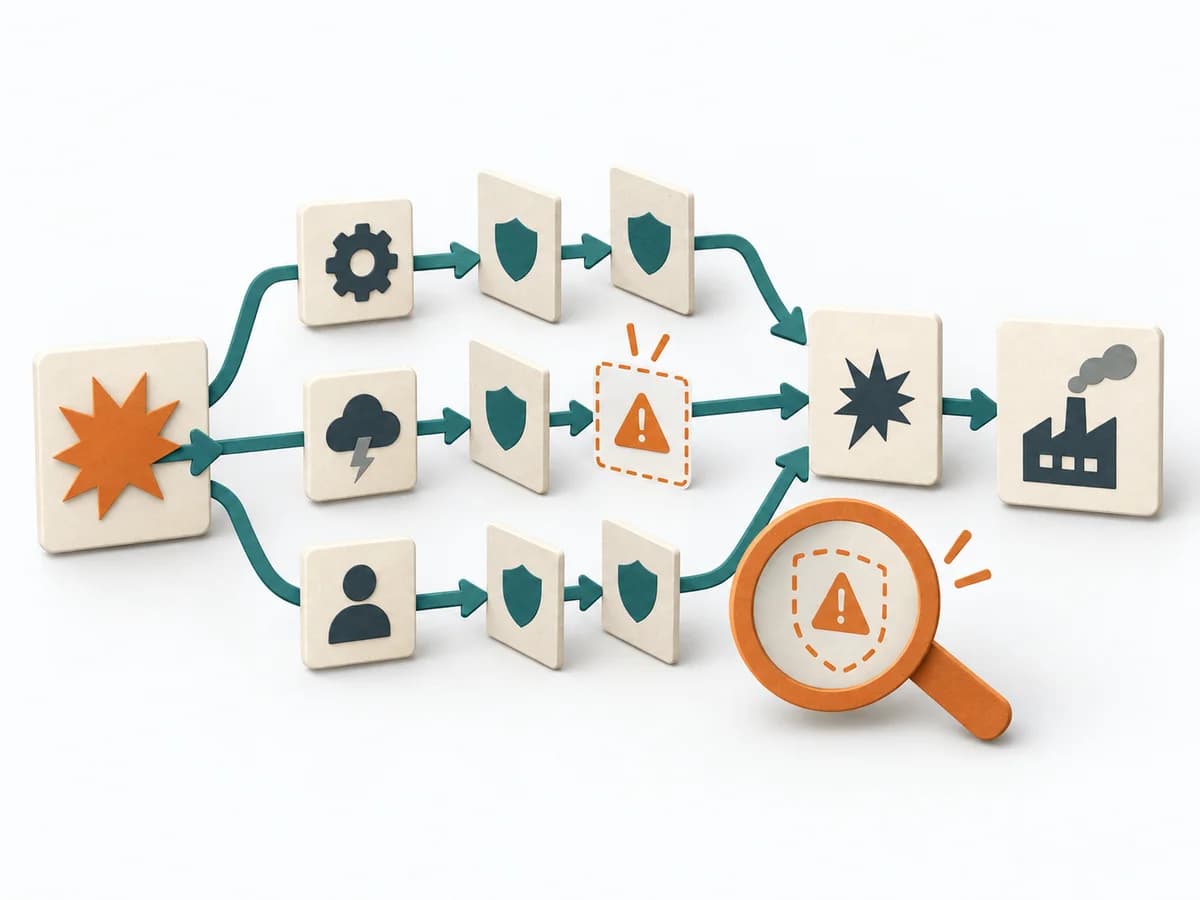 Engineering Failure Scenario Analysis |  Agile WSJF |  Systems Thinking Causal Loop Diagram |  Systems Thinking Current Reality Tree |
|---|---|---|---|---|
Purposedifferent | In critical processes, it is not enough to plan only for the normal case. Failure Scenario Analysis looks at the path into failure and shows which failures, chains, and control gaps cause the most damage. | When many tasks compete for the same capacity, it orders work by economic impact. It makes time lost, benefit, and effort comparable together. | A Causal Loop Diagram makes feedback, reinforcement, and balance in a system legible. It uncovers side effects and self-reinforcement that stay hidden in linear explanations. | A Current Reality Tree condenses many symptoms into a few causal chains. The method makes visible which core problems drive several negative effects at once. |
Complexitydifferent | Medium | High | Medium | High |
Timedifferent | 1-3 h | 45-90 min | 1-3 h | 2-6 h |
Participantsdifferent | 3-8 | 3-10 | 2-8 | 3-8 |
Formatsame | Workshop | Workshop | Workshop | Workshop |
Outputdifferent | Failure Scenarios, Risk Notes, Control Gaps, Test and Response Actions | Ranked Backlog, Cost-of-Delay Assumptions | Causal Loop Diagram, Feedback Notes, Leverage Points | Current Reality Tree, Core Problems, Intervention Ideas |
Tagsno overlap | FailureResilienceRisk | LeanEconomicsSequencePrioritization | FeedbackSystems thinkingCausalityDynamics | Systems thinkingRoot causeConstraintsCausality |