View methods side by side.
Choose up to four methods. Add them using the search and share the comparison by copying its link.
| Criterion | 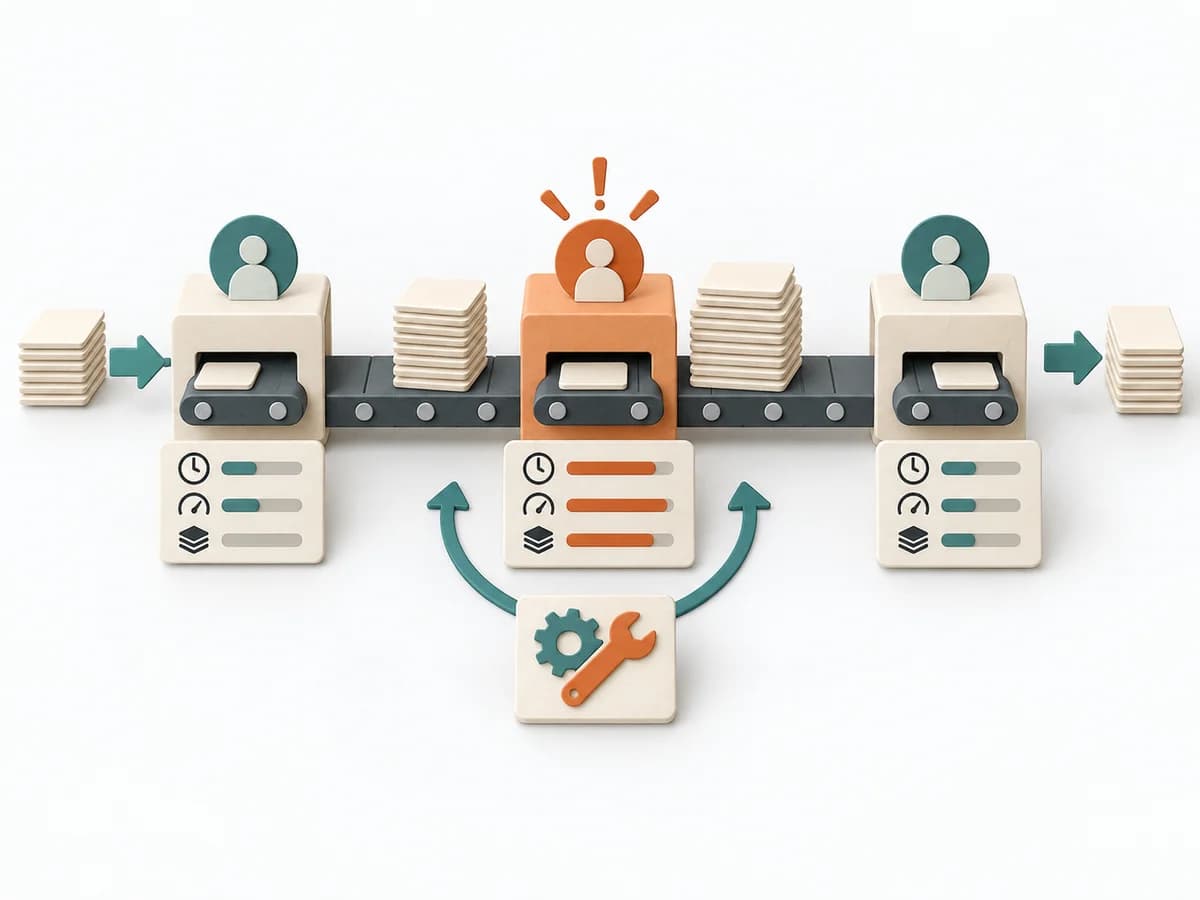 Operations Bottleneck Analysis | 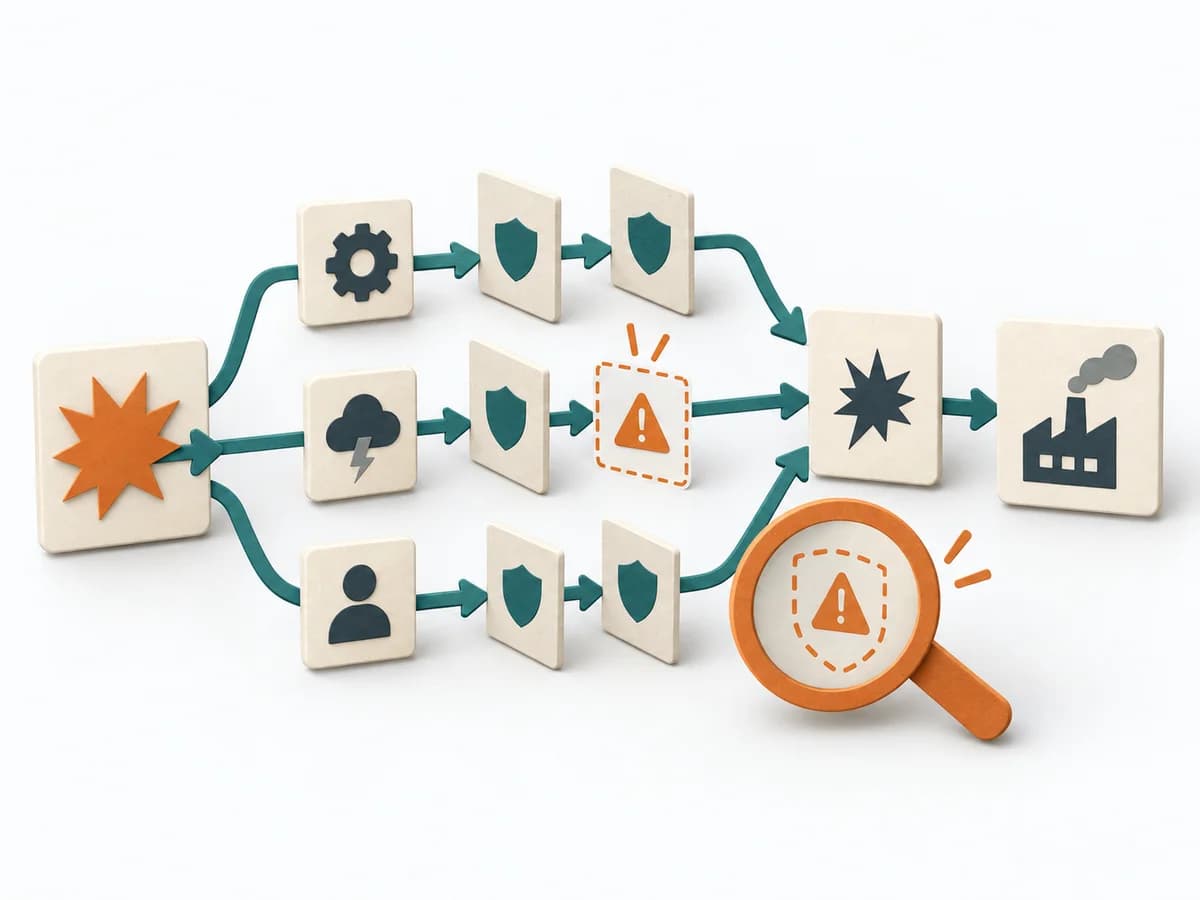 Engineering Failure Scenario Analysis |  Product Discovery Assumption Mapping |  Product Strategy Counter Metrics |
|---|---|---|---|---|
Purposedifferent | For a flow that backs up at one point, the method looks for the capacity limit with the greatest leverage. It explains why extra effort elsewhere barely improves throughput. | In critical processes, it is not enough to plan only for the normal case. Failure Scenario Analysis looks at the path into failure and shows which failures, chains, and control gaps cause the most damage. | When assumptions still sit unordered in the room, it weighs uncertainty against leverage. It makes visible which hypotheses should be checked first. | When a headline metric could mask side effects, it adds guardrail signals against unwanted outcomes. It connects customer value, product logic, and decision priorities. The result is captured as a counter-metric list and guardrail definitions. |
Complexitydifferent | Medium | Medium | Medium | Low |
Timedifferent | 1-3 h | 1-3 h | 45-60 min | 30-60 min |
Participantsdifferent | 3-8 | 3-8 | 2-8 | 2-6 |
Formatdifferent | Workshop + async | Workshop | Workshop + async | Workshop + async |
Outputdifferent | Bottleneck Map, Flow Metrics, Improvement Options, Follow-up Measures | Failure Scenarios, Risk Notes, Control Gaps, Test and Response Actions | Assumption map, Test backlog, Risk ranking | Counter Metric List, Guardrail Definitions |
Tagsno overlap | FlowMeasurementConstraints | FailureResilienceRisk | AssumptionsRiskExperimentsValidation | MetricsMeasurementStrategyExperiments |